


Increase your system's observability with OpenTelemetry support in NServiceBus

When code breaks, our first move is carefully inspecting the call stack. It helps us find the needle in the haystack by understanding how, where, and why the failure occurred, including how we got there.
However, in a message-based system, we no longer have a single call stack. We’ve exchanged it for a haystack of call stacks, which makes finding the needle (the root cause of the failure) even more difficult.
🔗The problem
Because message-driven systems are asynchronous and run in multiple processes, debugging is naturally more complex than in a single-process application. Failures surface as failed messages in a specific endpoint, which could be symptoms of an issue happening further upstream. We need to understand how and where the business transaction started, how the message flow works, the order in which messages were processed, and have a thorough understanding of the components involved.
Debugging these issues is tedious, cumbersome, and sometimes downright painful. In addition, setting up a debuggable environment is a serious challenge as we need to understand the components involved in the scenario we’re debugging, which could span different solutions, repositories, or endpoints, each of which may require additional infrastructure to be available.
Luckily, we can address these concerns with observability.
🔗Observability
Observability is how well we can figure out what we don’t know when it comes to system behavior based on its external outputs. For example, in a highly observable system, we can easily infer the internal state and behavior of the system without going back into the code to make changes when something unexpected occurs.
The Particular Service Platform includes a wide range of observability features, including ServiceInsight’s sequence diagram and flow diagram. When auditing is enabled, ServiceInsight can visualize the flow of messages across multiple NServiceBus endpoints. In addition, you can inspect the message headers and body, allowing us to figure out what’s going on in any flow of messages.
ServicePulse also exposes a range of metrics that provide insight into the system’s behavior. One of the main benefits of the Particular Service Platform is that it allows for black-box instrumentation. Apart from enabling auditing and metrics in your configuration, it doesn’t require any code changes to gather instrumentation from your endpoints.
However, distributed systems are inherently complex and consist of many components: message brokers, databases, distributed caches, integration points, REST APIs, front-ends, and more. All of these components can participate in a business transaction. Still, the information captured in messages may represent only a small part of that business transaction—not enough to tell the whole story.
🔗A sample interaction
Let’s consider a system with an order process flow that looks like this:
flowchart TD
    A[ASP.NET Core OrderController] -->|1. Place order| B[Sales]
    B --> |2. Start order process| C[Order saga]
    C --> |3. Charge order| D[Payments]
    D --> |4. Order charged| C[Order saga]
    C --> |5a. Ship order| E[Shipping]
    C --> |5b. Bill order| F[Billing]
In the controller method, nothing fancy is happening; we’re just mapping the data collected in the web request to a message and sending it to the Sales endpoint.
But what if we mess up and swap the shipping and billing addresses?
As far as the Sales endpoint is concerned, that input is perfectly valid. But unfortunately, the endpoints cannot validate that we didn’t swap the data, and inspecting the message bodies won’t give us insight into where we messed up. After all, both look like valid addresses. So now we’re shipping orders to the wrong address and wonder why so many customers are complaining they never received their order.
We’re facing a blind spot because we can’t investigate what context, decision-making, or flow led to the creation of that initial message. We can’t see the entire story of the interaction all at once. The example might be simplistic, but it shows why we need insight into the whole business transaction, especially in large and complex distributed systems where additional decisions are made every step of the way.
🔗OpenTelemetry and NServiceBus
Enter OpenTelemetry: a vendor-agnostic, cross-platform, and open-source standard for observability to help standardize how we instrument, collect, and export instrumentation from our applications. OpenTelemetry includes tools and SDKs for each programming language to capture and export your applications’ metrics, traces, and logs.
And now, OpenTelemetry is available in NServiceBus.
OpenTelemetry tracing was adopted in .NET in the System.Diagnostics.Activity API in .NET 5. 1 It’s also available for earlier versions 2 using the dedicated System.Diagnostics.DiagnosticSource NuGet package.
With the advancements made in the industry for observability with OpenTelemetry, we want to strengthen the observability of the platform further. Therefore, from NServiceBus version 8 onwards, you can enable OpenTelemetry on your NServiceBus endpoints to seamlessly capture instrumentation and export it to your observability backend.
By enabling available instrumentation libraries, we can observe quite a bit without adding application-specific tracing. For example, we can solve the address-swapping example above by enabling instrumentation in both ASP.NET Core and NServiceBus, and then adding information to the spans emitted by these libraries. The ASP.NET Core instrumentation library creates a span that represents the request submitted by the user, to which we can add a span containing the shipping and business address. NServiceBus already adds a span when ingesting a message from the queue, at which point we could add any other relevant tags.
Whether in a controller method or a message handler, we could add code like this:
Activity.Current?.AddTag("order.id", request.OrderId);
Activity.Current?.AddTag("order.shipping_address", request.ShippingAddress);
Activity.Current?.AddTag("order.billing_address", request.BillingAddress);
Based on the added tags, if we carefully compare the initial request’s tags with the message processed in the endpoint, we would quickly identify that we reversed the billing and shipping addresses.
Note: Even though we’re using addresses in this example, adding personally identifiable information (PII) to telemetry is never a good idea! Remember that this information is sent to an external system, your observability backend. Imagine getting a right to be forgotten request to remove data when you have exposed personal information in your telemetry. The flow in this article is just a simple example to illustrate the point…and an opportunity to remind you of this best practice at the same time.
Here’s a screenshot of how an enriched span would look like in Jaeger:
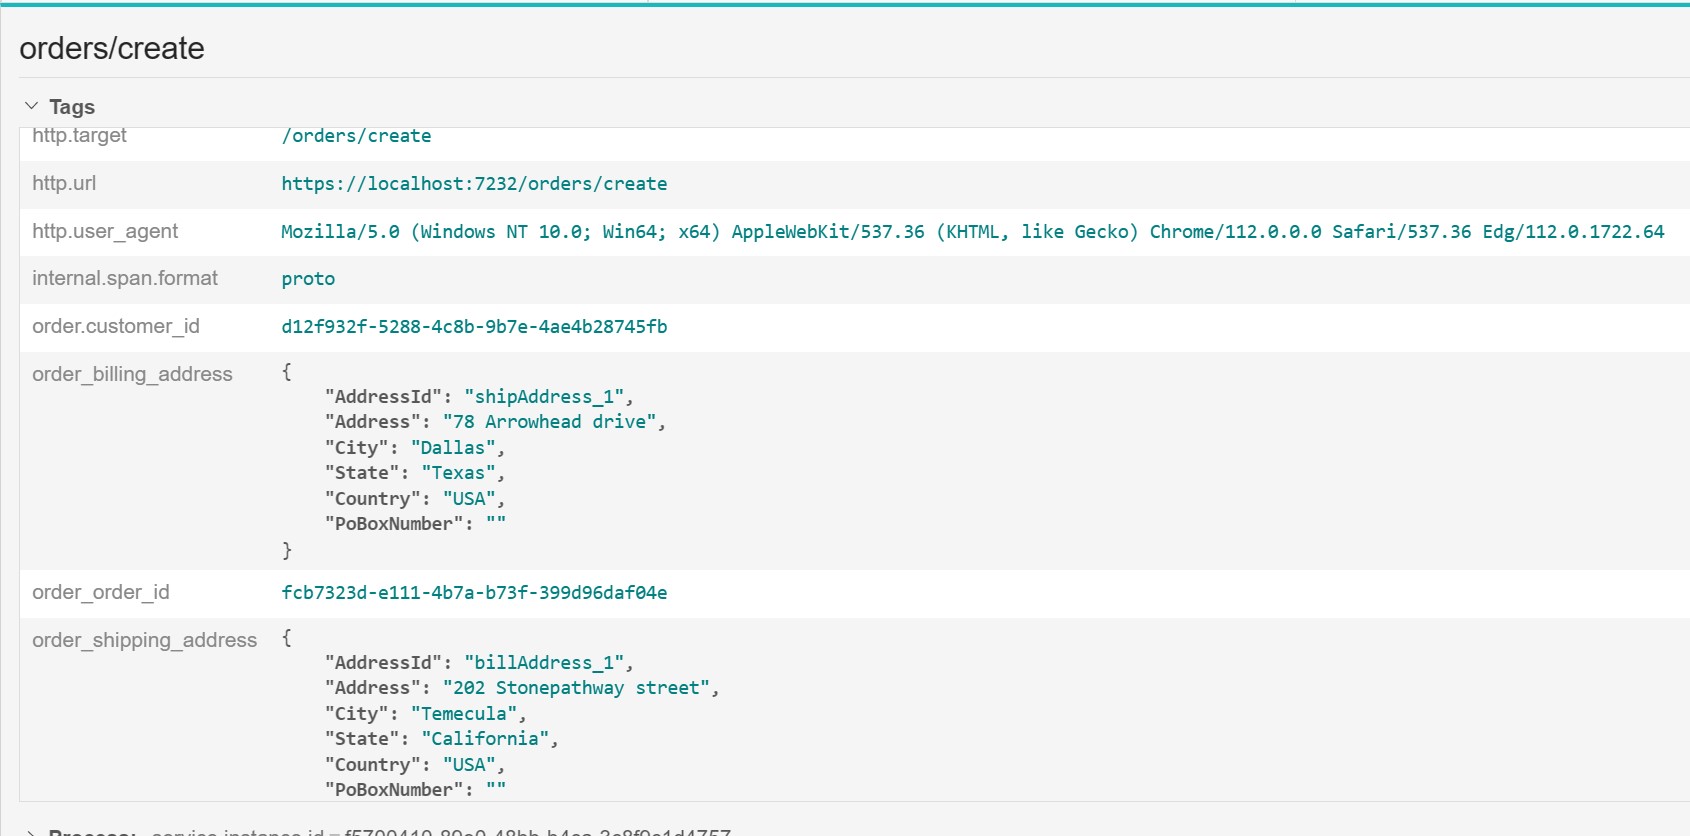
…but we could also use Azure Application Insights, Elastic, Honeycomb, or a different tracing backend. The main advantage of using OpenTelemetry is that you can use any vendor that best suits your needs without changing the instrumentation code or libraries. The only change required would be configuring the appropriate exporter to send your instrumentation data to the right place.
With OpenTelemetry enabled across all components of a system, we can create system-wide observability and understand which components take part in the business transaction from beginning to end.
To enable OpenTelemetry in your NServiceBus endpoint, add the following:
endpointconfiguration.EnableOpenTelemetry();
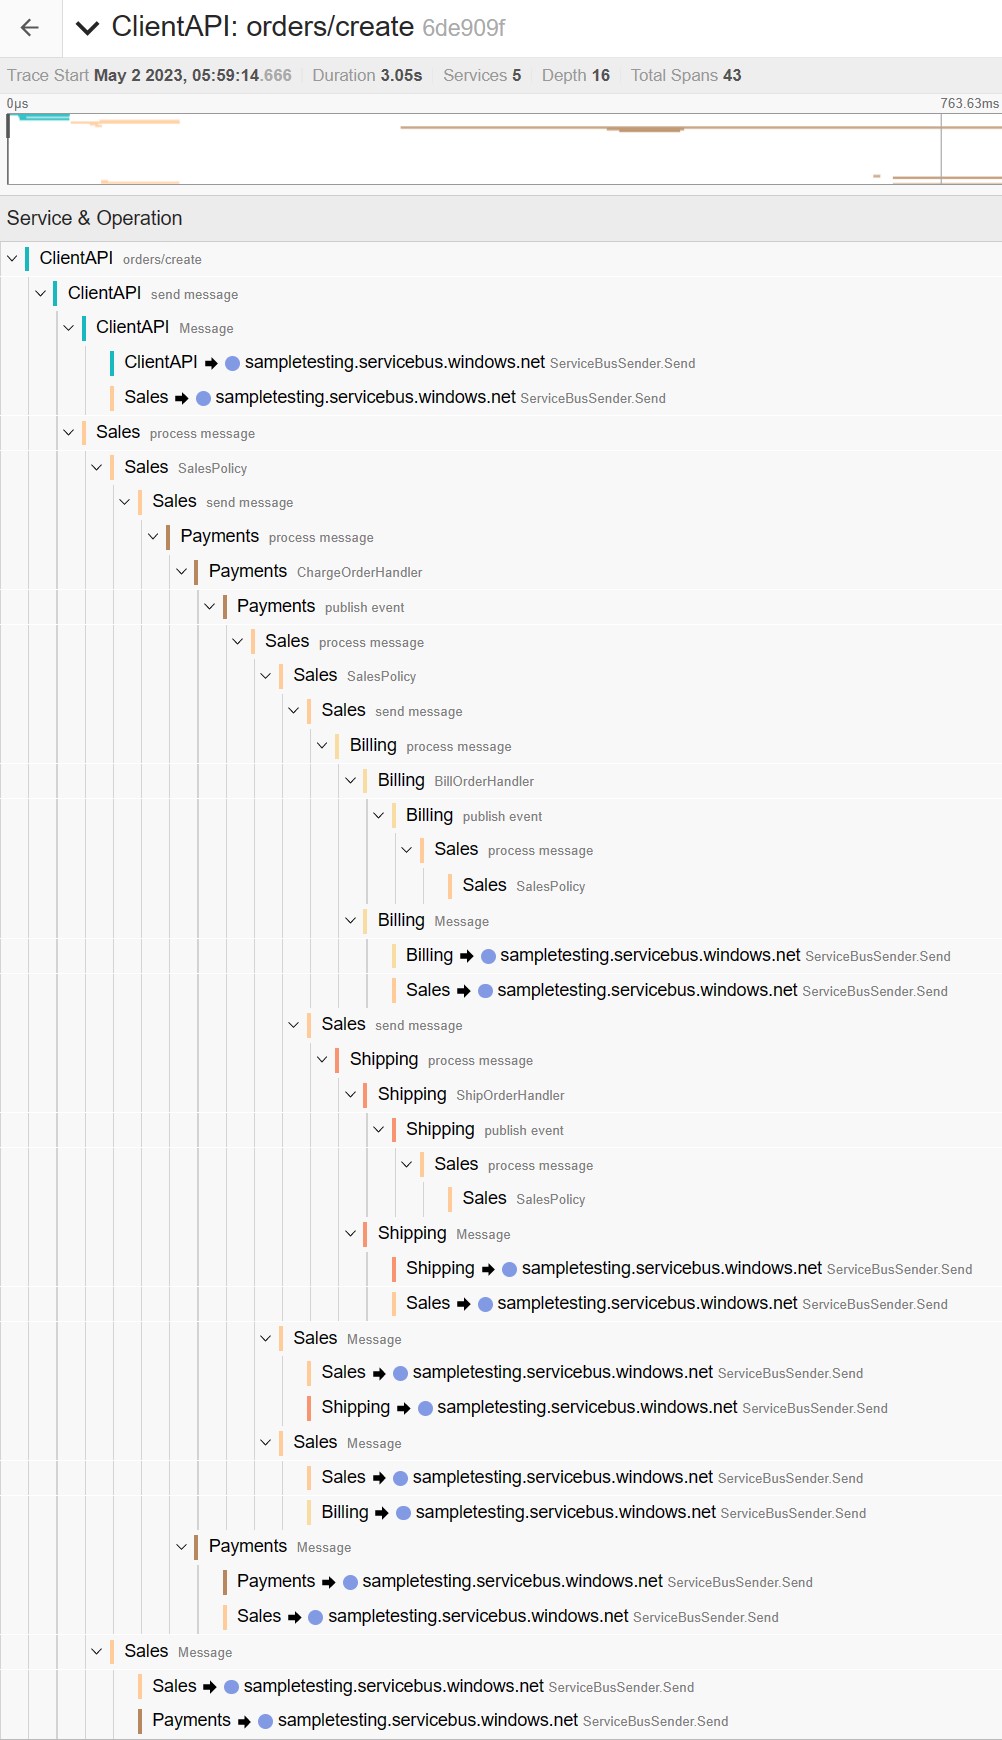
NServiceBus will then capture instrumentation for every incoming and outgoing message operation in an endpoint. If the underlying message queue initiates a trace, NServiceBus will create a child span when processing that message. Otherwise, NServiceBus will create a new one. Any subsequent outgoing operations result in child spans on the incoming message span.
OpenTelemetry operates under an opt-in model, so even though OpenTelemetry is enabled on the endpoint, you still need to set up a TracerProvider to collect that instrumentation and export it to a tool of your choice.
var tracingProviderBuilder = Sdk.CreateTracerProviderBuilder()
    .AddSource("NServiceBus.Core")
    // ... Add other trace sources
    // ... Add exporters
    .Build();
Then you can see the full trace:
If you want to enrich the telemetry created by NServiceBus, you can do so inside the message handler. You can either start a dedicated span, which will automatically be created as a child span by the .NET Activity API and propagate the context as expected, or add additional tags and events to the active span without creating a new span, as in the example. If you want to add specific details across all spans, you can customize the OpenTelemetry traces using a custom processor.
Logging is important too. We’ve been doing that for years, but with OpenTelemetry’s focus on telemetry correlation it gets a lot more powerful. We can connect those logs with the traces we’re now collecting to tie it all together. Check out our sample on connecting OpenTelemetry traces and logs to see how to do that.
🔗Summary
Ready to try it out on your own? In that case, we have multiple samples available for you to try out, including dedicated code samples for Prometheus and Grafana, Azure Application Insights, and Jaeger. As you use OpenTelemetry to improve your root-cause analysis, please let us know how it’s going and how we can further improve the observability of the platform.
All this is baked right into NServiceBus version 8. However, if you’re still using NServiceBus version 7, you can use Jimmy Bogard’s community package 3 to bridge the gap.
When you’re debugging a distributed system, haystacks are everywhere. But with OpenTelemetry, you have the necessary tools to find the needle.
 Share on Twitter
About the author

The .NET tracing API for OpenTelemetry uses the term
Activityinstead ofSpanfrom the OpenTelemetry specification. However, throughout this post, we will use the OpenTelemetry specification terminology ofSpanand its related terms.Even .NET Framework
This package has been deprecated for NServiceBus version 8 and above in favor of the built-in implementation.