


Real-time visualization and monitoring for distributed systems
Monitor the health and performance of your system's endpoints, with minimal configuration. Visualize system behavior, plug in your own custom checks for database and 3rd party dependencies, and observe real-time message throughput.
Platform features
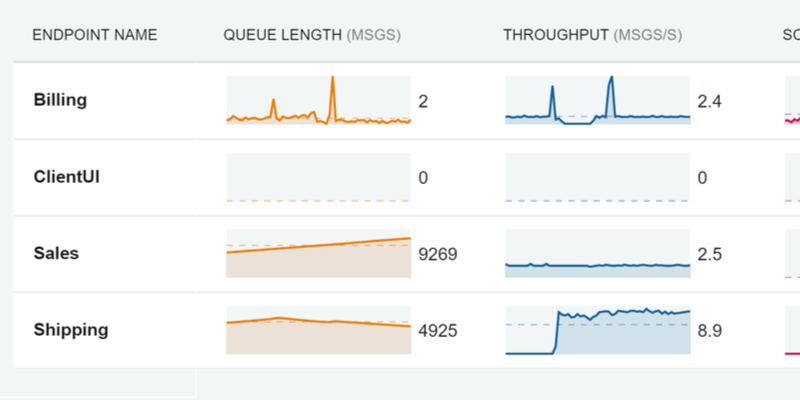
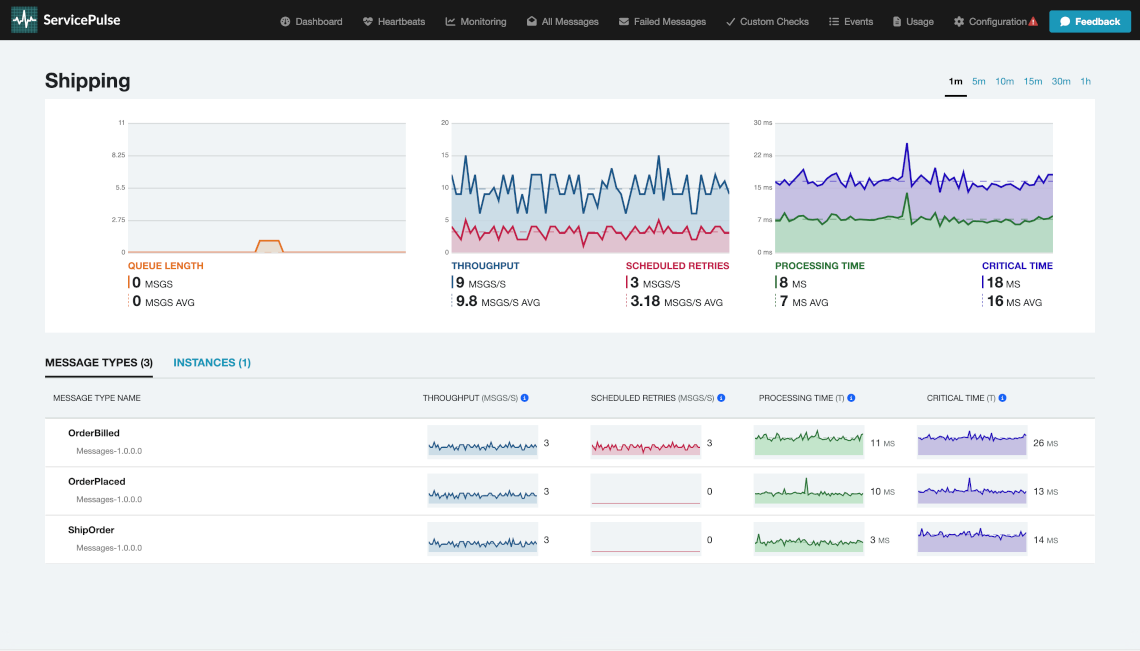
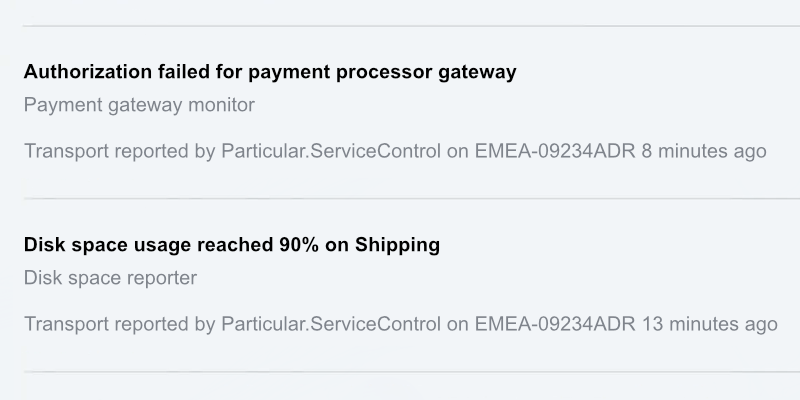
Performance and status monitoring
Monitor the performance of your system with real time data. Receive notifications of endpoint processing errors and monitor endpoint availability and health.
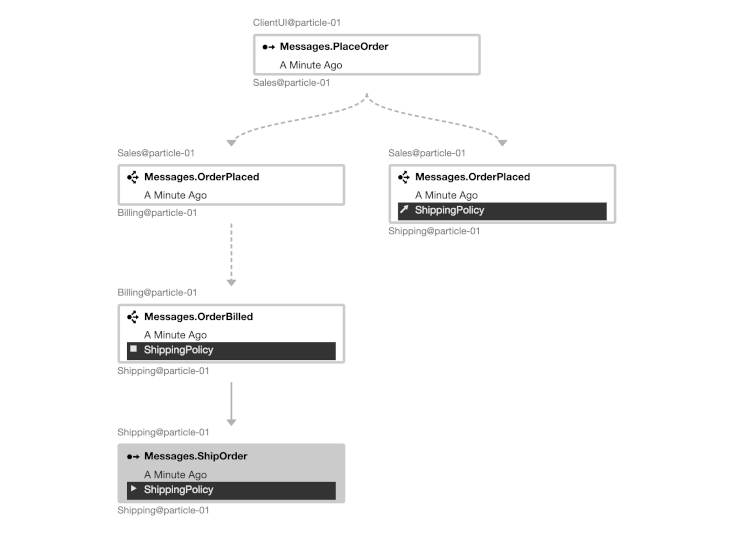
Visualize your system behavior
Gain actionable insights from your message flows by viewing how messages move between endpoints and how endpoints interact using flow and sequence diagrams. Analyze and troubleshoot long-running processes and workflow interactions with the Saga view. Monitor delivery, processing, and overall performance down to the specific message level.
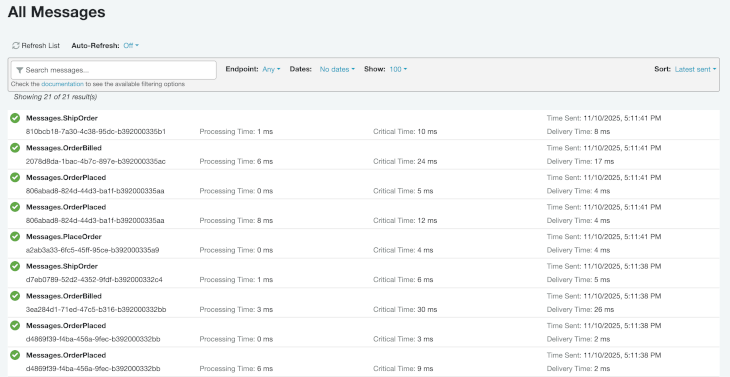
Find messages and browse detailed performance information
Find messages with a full-text search of any message property. Get per-message and down to the millisecond display of the time taken to deliver a message, the message's processing time, and the overall end-to-end time.
Extensible and customizable
Leverage built-in custom checks to make sure all your specific endpoints' needs are met, or write your own extensions to report on the status of key system dependencies. View system status from one place to answer health and performance issues more quickly.