


Productivity power-ups in the August Platform release
This month, we released an update to our platform, designed primarily to give you a much better user experience. If you have been frustrated by having to deal with large numbers of failed messages, or if you routinely deal with relatively large messages, we have included new features specifically to address your pain points. We’ve also added multiple productivity enhancements across the platform, so there’s sure to be something in it for everybody.
Head over to our downloads page for the latest versions, or read on for the details.
🔗Failed message grouping
At times, some event might lead to a large amount of failed messages within ServicePulse. Maybe something failed within your infrastructure: a web service was unreachable, a disk filled up, a server restarted, or maybe a new version of an endpoint was released with a bug. This isn’t a problem; this is your system dealing with failure as designed.
But dealing with all of those failed messages can be a real pain. Previously, ServicePulse gave you the ability to archive or retry all messages, or retry selected messages. Unfortunately, ServicePulse would only show you 50 messages at a time! This made it very difficult retry all failed messages of a given type if they counted in the hundreds. Worse yet, the retry process was slow and error prone, and the more messages you attempted to retry at a time, the worse it became.
What would be much better would be a grouping of similar failed messages, allowing you to retry an entire group, and know that they would all be retried reliably, regardless of the number of messages involved.
We’ve been doing a lot of work on failed message handling across our platform, and we think you’re going to like our new message grouping features.
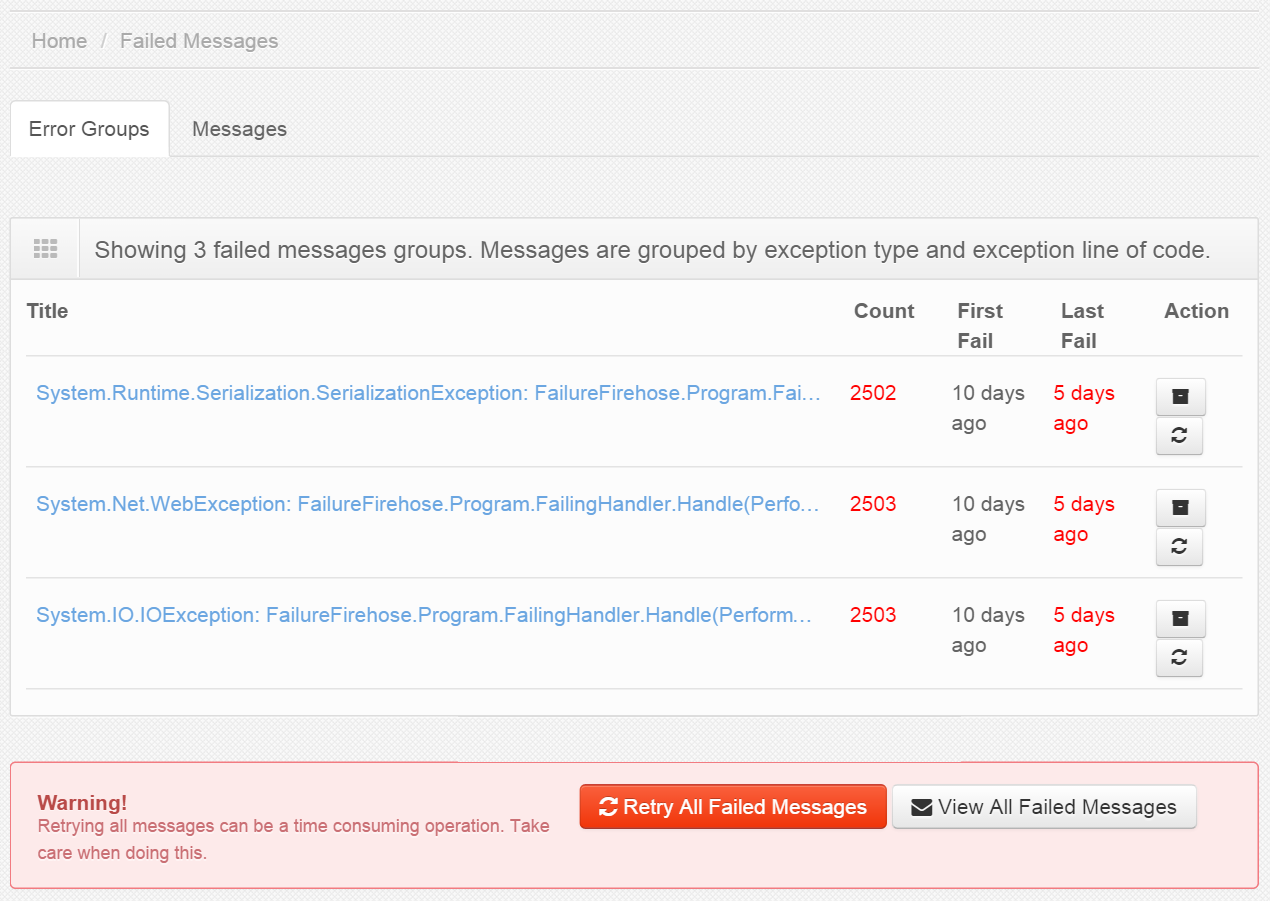
The new Failed Messages screen in ServicePulse automatically groups similar failed messages so that they can be handled in bulk. If two or more failed messages were caused by the same exception in the same place, then it is likely that they can be dealt with in the same way. Each group can be retried or archived as a single operation. You can get details for each group to see a full list of messages and deal with them individually if you still need fine-grained control.
When you first install the updated platform components, all of your unresolved failed messages will be automatically grouped as a background process. This may take a some time, depending on how many unresolved failed messages you have, during which you will continue to see the old Failed Messages screen. Once the background process has completed, the new Failed Messages screen will appear.
When you choose to retry messages, whether an entire group or just a subset of messages, you will benefit from the updated retries capability of ServiceControl. We’ve invested a lot of effort to speed up the retry process and make it more robust. Large groups of messages will be split up into batches and dispatched separately, with progress reported for each batch.
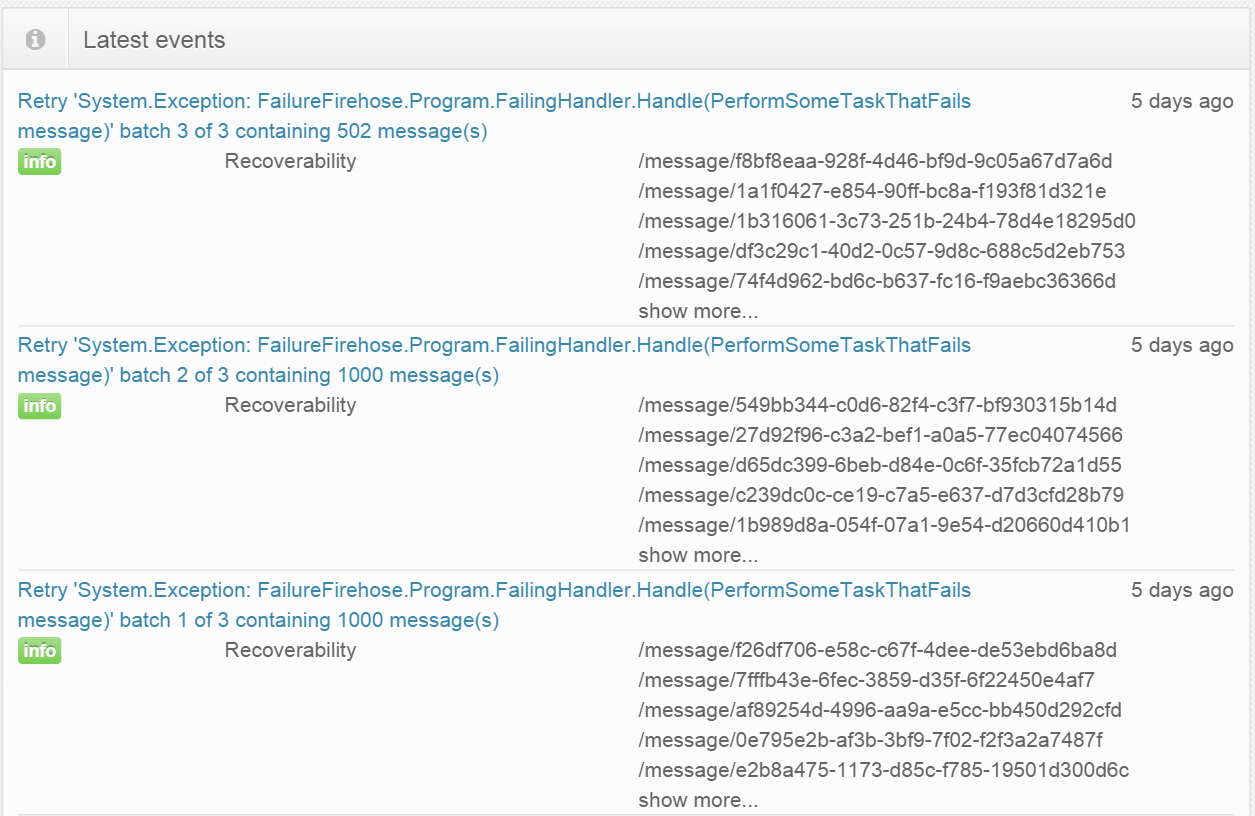
The new retries capability uses a new queue named particular.servicecontrol.staging. Messages to be retried get batched and loaded into this queue. When the batch is fully staged, the entire contents are forwarded to their destination.
With these new changes to failed message groups, retrying or archiving hundreds of messages can now be handled with just a few clicks. The next time you have a flood of failed messages for whatever reason, the new failed message grouping features are going to save you a ton of time and headaches.
🔗Very large messages
To audit all messages flowing through your system, you need to store copies of them. Most of the time, messages are fairly small, and this isn’t a problem. But, to keep very large messages from affecting the performance of the system, previous versions of ServiceControl did not store the message body for audited messages larger than 100KB. Anything larger got discarded, and attempting to view the message within ServiceInsight would show only a blank window.
But 100KB is an arbitrary setting. You might regularly have messages that are just over that 100KB limit, and still would like to be able to view them in ServiceInsight. Maybe you are even willing to sacrifice some performance to have more information.
In order to allow auditing larger messages, the maximum message body size is now configurable. Additionally, if the message body of audited messages are larger than the maximum configured size, ServiceInsight will now present a meaningful message.

Now you can make the decision on how large is too large for yourself, based on what makes sense for your organization. If you ever run into a message that goes above the limit, ServiceInsight will tell you what’s going on and what to do about it.
🔗More focused tooling
In this release, we’ve paid a lot of attention to common workflows. We have optimized our tools based on your suggestions, and we’ve made a bunch of improvements intended to help you get your job done quicker, more efficiently and with fewer distractions.
🔗Stack trace coloring
Stack traces are invaluable for debugging, but previously we presented them as a wall of plain black text, which can be difficult for the brain to make sense of quickly. It would be ideal if the structure of the stack trace would make itself readily apparent so that you could understand it more quickly and continue with debugging.
To make stack traces in ServiceInsight easier to read, we are now using syntax highlighting to display them in color. Stack traces displayed in the Headers tab, and also in the Exception popup of the Flow Diagram tab (shown after clicking Exception type) will both be colored.

With this small change, it’s now much easier to see the method name, file path, and line number where an exception occurred, so you can pull up the offending code and fix the problem.
🔗Better 3rd party integration
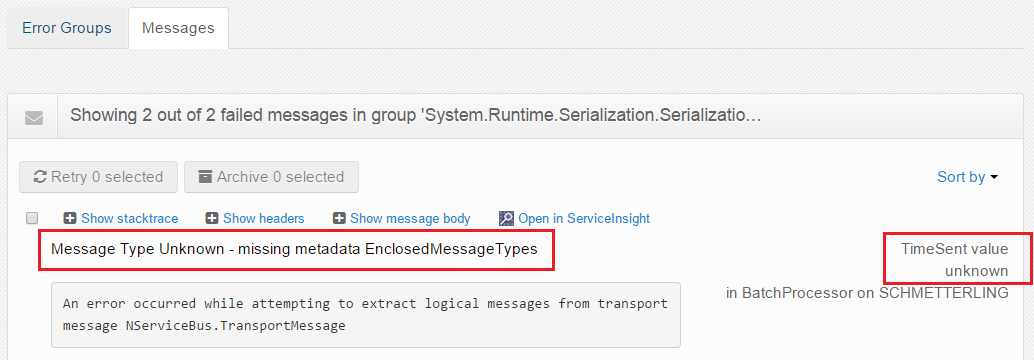
It’s possible for NServiceBus to ingest messages created manually on the queuing infrastructure, perhaps as part of a 3rd party integration, but these messages commonly lack information in specific headers. Missing headers creates very odd output in some places, with values either missing or using default values like DateTime.MinValue, which created a lot of confusion.
It would be much clearer if these missing values were communicated better by providing meaningful descriptions, showing the true nature of the missing values. We have made these changes in ServicePulse and ServiceInsight.
In ServicePulse, Unknown will be displayed for missing Time Sent and Message Type values in the Failed Messages list.
The same goes for ServiceInsight in the Messages list, Flow Diagram, and Saga View.
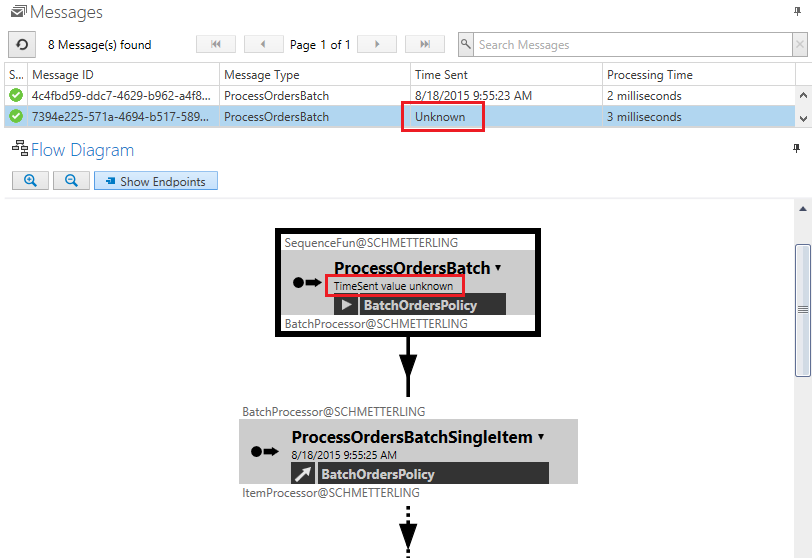
With this change, it’s clear that the information is indeed not available, and not due to a random system error.
🔗Streamlining ServiceInsight message list
In the previous version of ServiceInsight, the message list contained seven columns: Status, Message ID, Message Type, Time Sent, Critical Time, Processing Time and Delivery Time. This was too much information, making for a crowded grid, especially at lower monitor resolutions, where space is at a premium and horizontal scroll bars serve only to hide information from view.
ServiceInsight is primarily a tool to help you while you are developing and debugging your systems, so it would be more helpful to focus only on the information necessary for that purpose.
To accomplish this, we have streamlined the information displayed in ServiceInsight. Critical Time (the amount of time a message has to wait to be processed) and Delivery Time (the amount of time it takes for a message to be delivered to its destination) are related to monitoring, and are not that useful in ServiceInsight. Additionally, at times these calculated values were inaccurate due to clock drift between different servers, causing unnecessary confusion.
For these reasons, we have removed Critical Time and Delivery Time from the Messages list view to allow you an unobstructed view of the information that you really need to get an understanding of what your system is doing.
🔗Usability improvements
We’ve made a lot of other improvements to make our tools easier to use.
In previous versions of ServiceInsight, message nodes were all the same size, regardless of content. Now, the width adapts to the length of its content.
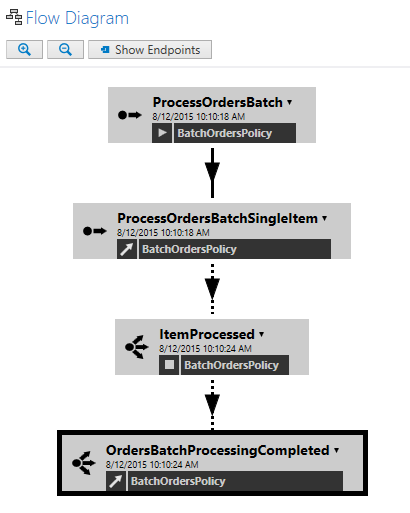
Now you can see everything you need, without resorting to a rollover tooltip.
In ServicePulse, we’ve reorganized the Endpoints Overview and Configuration screens to display their contents alphabetically, making the desired content easier to find. We’ve enabled text to wrap, where appropriate, so that you can see the full names of things without extra hassle. We’ve also introduced a new version notification, so you can always be sure you’re running the latest and greatest version of ServicePulse.
🔗Summary
A lot of great things went into this release of the platform, with the aim of removing some common pain points and frustrations, and optimizing things so that you can do your job better. Of course, we fixed a bunch of not-so-common bugs too. For the complete details, you can refer to the release notes for ServiceInsight 1.3.0, ServicePulse 1.2.0, and ServiceControl 1.6.0.
You can get the newest versions of these tools on our downloads page. We would love to hear what you think!
About the authors: Weronika Łabaj, Mike Minutillo, and John Simons are part of the Particular Software Engineering Team who are passionate about writing software that makes other developers happy.
 Share on Twitter