Maximizing fun (and profit) in your distributed systems
While you probably wouldn’t expect this from a software infrastructure company, we opened a theme park! Welcome to Particular World.
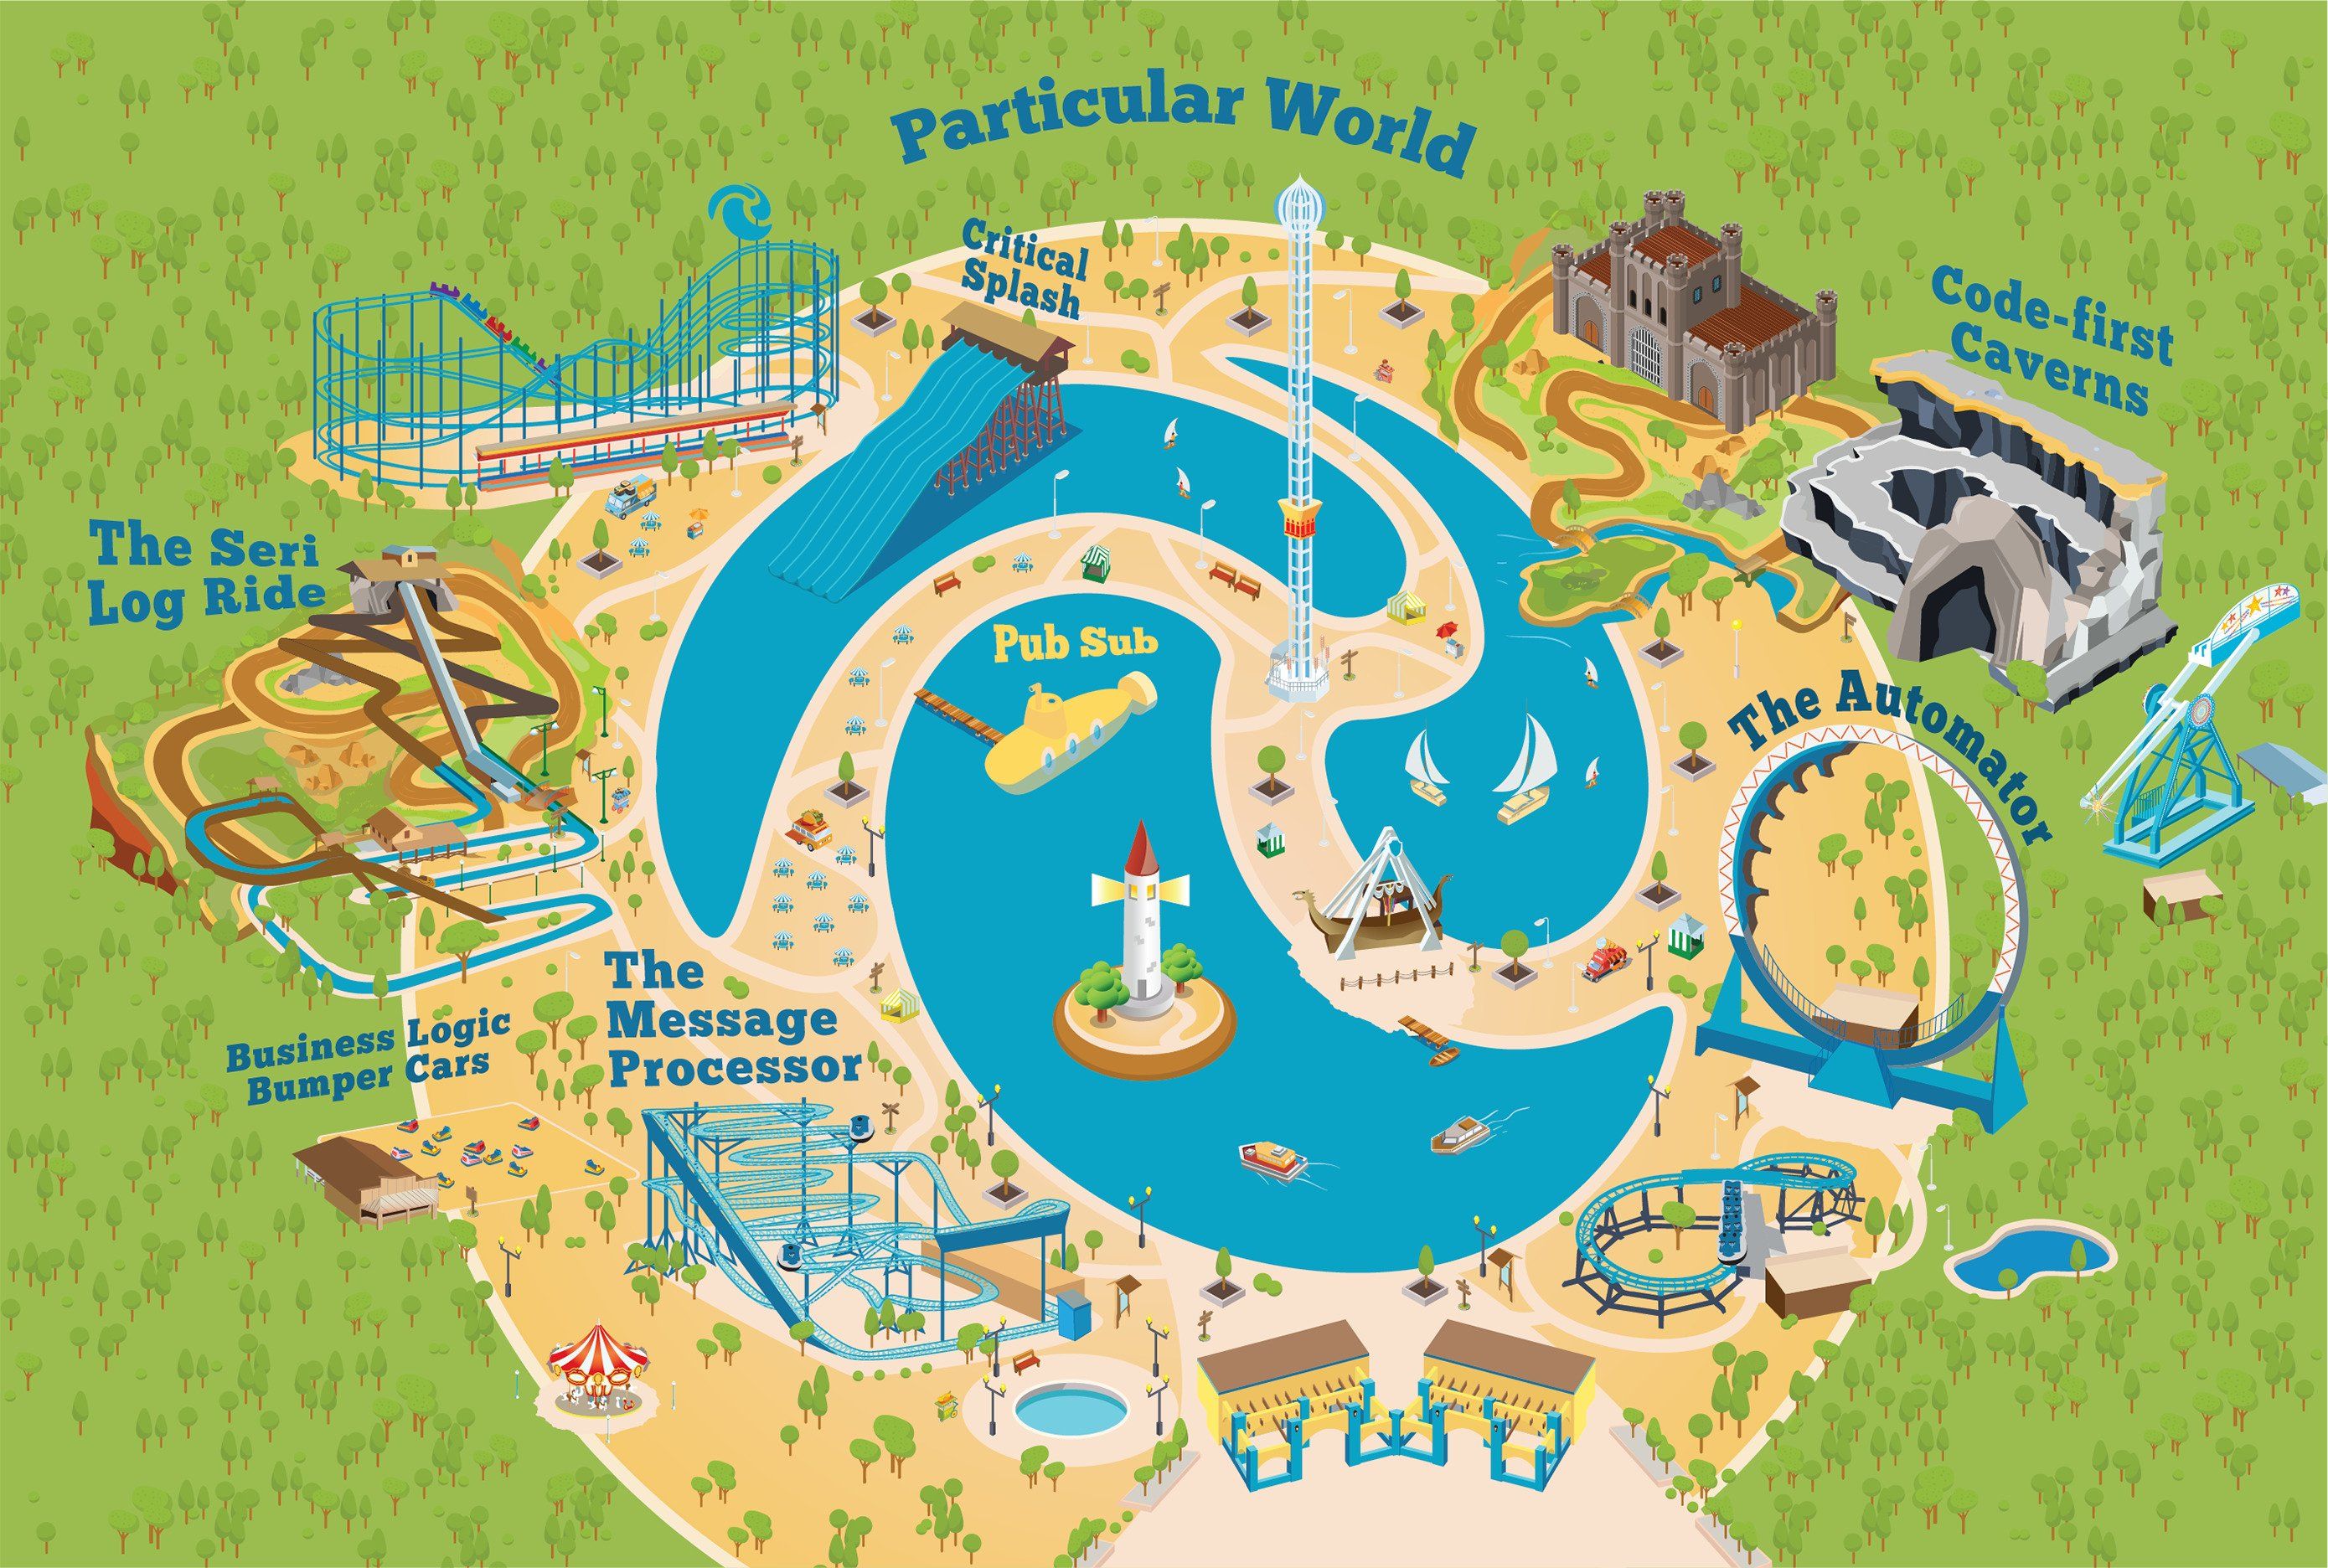
Based on our experience running business systems in production, we know we need to monitor our theme park to make sure it’s working properly. Luckily, there are tools in place that let us keep track of electricity and water usage, how much parking we have available, and how much trash the park generates.
This infrastructure monitoring helps us understand whether our theme park has the infrastructure it needs to operate. We can use this data to extrapolate when we need to upgrade the electrical system, add a new water pipe, add more bays to our carpark, or commission more trucks to haul away our trash. These same basic tools used for infrastructure monitoring would work whether we’d opened a theme park, a hospital, a police station, or a school.
Infrastructure monitoring is also common in the software industry. How many CPU cycles is a system using? How much RAM? What is the network throughput? Every software system is dependent on a few types of infrastructure (CPU, memory, storage, network), so it’s no surprise that there are lots of off-the-shelf tools that provide this capability.
Infrastructure monitoring tools generally treat systems as “black boxes” that consume resources. They don’t really provide you with any insight into what’s going on inside the box, why the box is consuming those resources, or how well it’s actually running.
To understand if our theme park is running efficiently or not, we’ll need monitoring tools that understand how theme parks really work. We need monitoring tools that can understand what’s going on inside the box.
🔗So how do theme parks work?
First and foremost, theme parks have attractions, and along with attractions come lines. The lengths of these lines can vary depending on a number of factors: the attraction’s popularity, the time of day, the time of year, weather, the average duration of a ride on the attraction, etc. While it’s impossible to get rid of lines completely, understanding how they work can help us maximize our park’s efficiency.
With that in mind, how do we monitor a theme park to see if it’s running efficiently? Generally speaking, we want to make sure people are moving through our park at a good pace. So we could narrow that down to two questions. First, how many people can ride a particular attraction in an hour? Second, which attractions have the longest lines?
Knowing the answers to these questions will give us a richer understanding of the behavior of our theme park and help us change over time to make it a more efficient (and profitable) business.
Luckily, our experience with monitoring distributed systems seems to apply really well to theme parks. The types of distributed systems that we monitor are made up of individual components that exchange and process messages. Each component has a queue of messages to process, just like the attractions in a theme park. To see if our messaging system is running efficiently, we could ask the same two questions: how quickly are messages processed by a particular component, and which components have the greatest backlog (and how bad is it)?
This is what application monitoring is all about. It’s a peek inside the black box that tells you why you’re consuming the resources you’re consuming.
Let’s see how we can use this style of application monitoring to understand the behavior of our theme park and messaging systems.
🔗How many people can ride an attraction?
Our first attraction is the Message Processor. It’s a “Wild Mouse” style roller coaster, which means it has small cars designed to seat one passenger at a time.
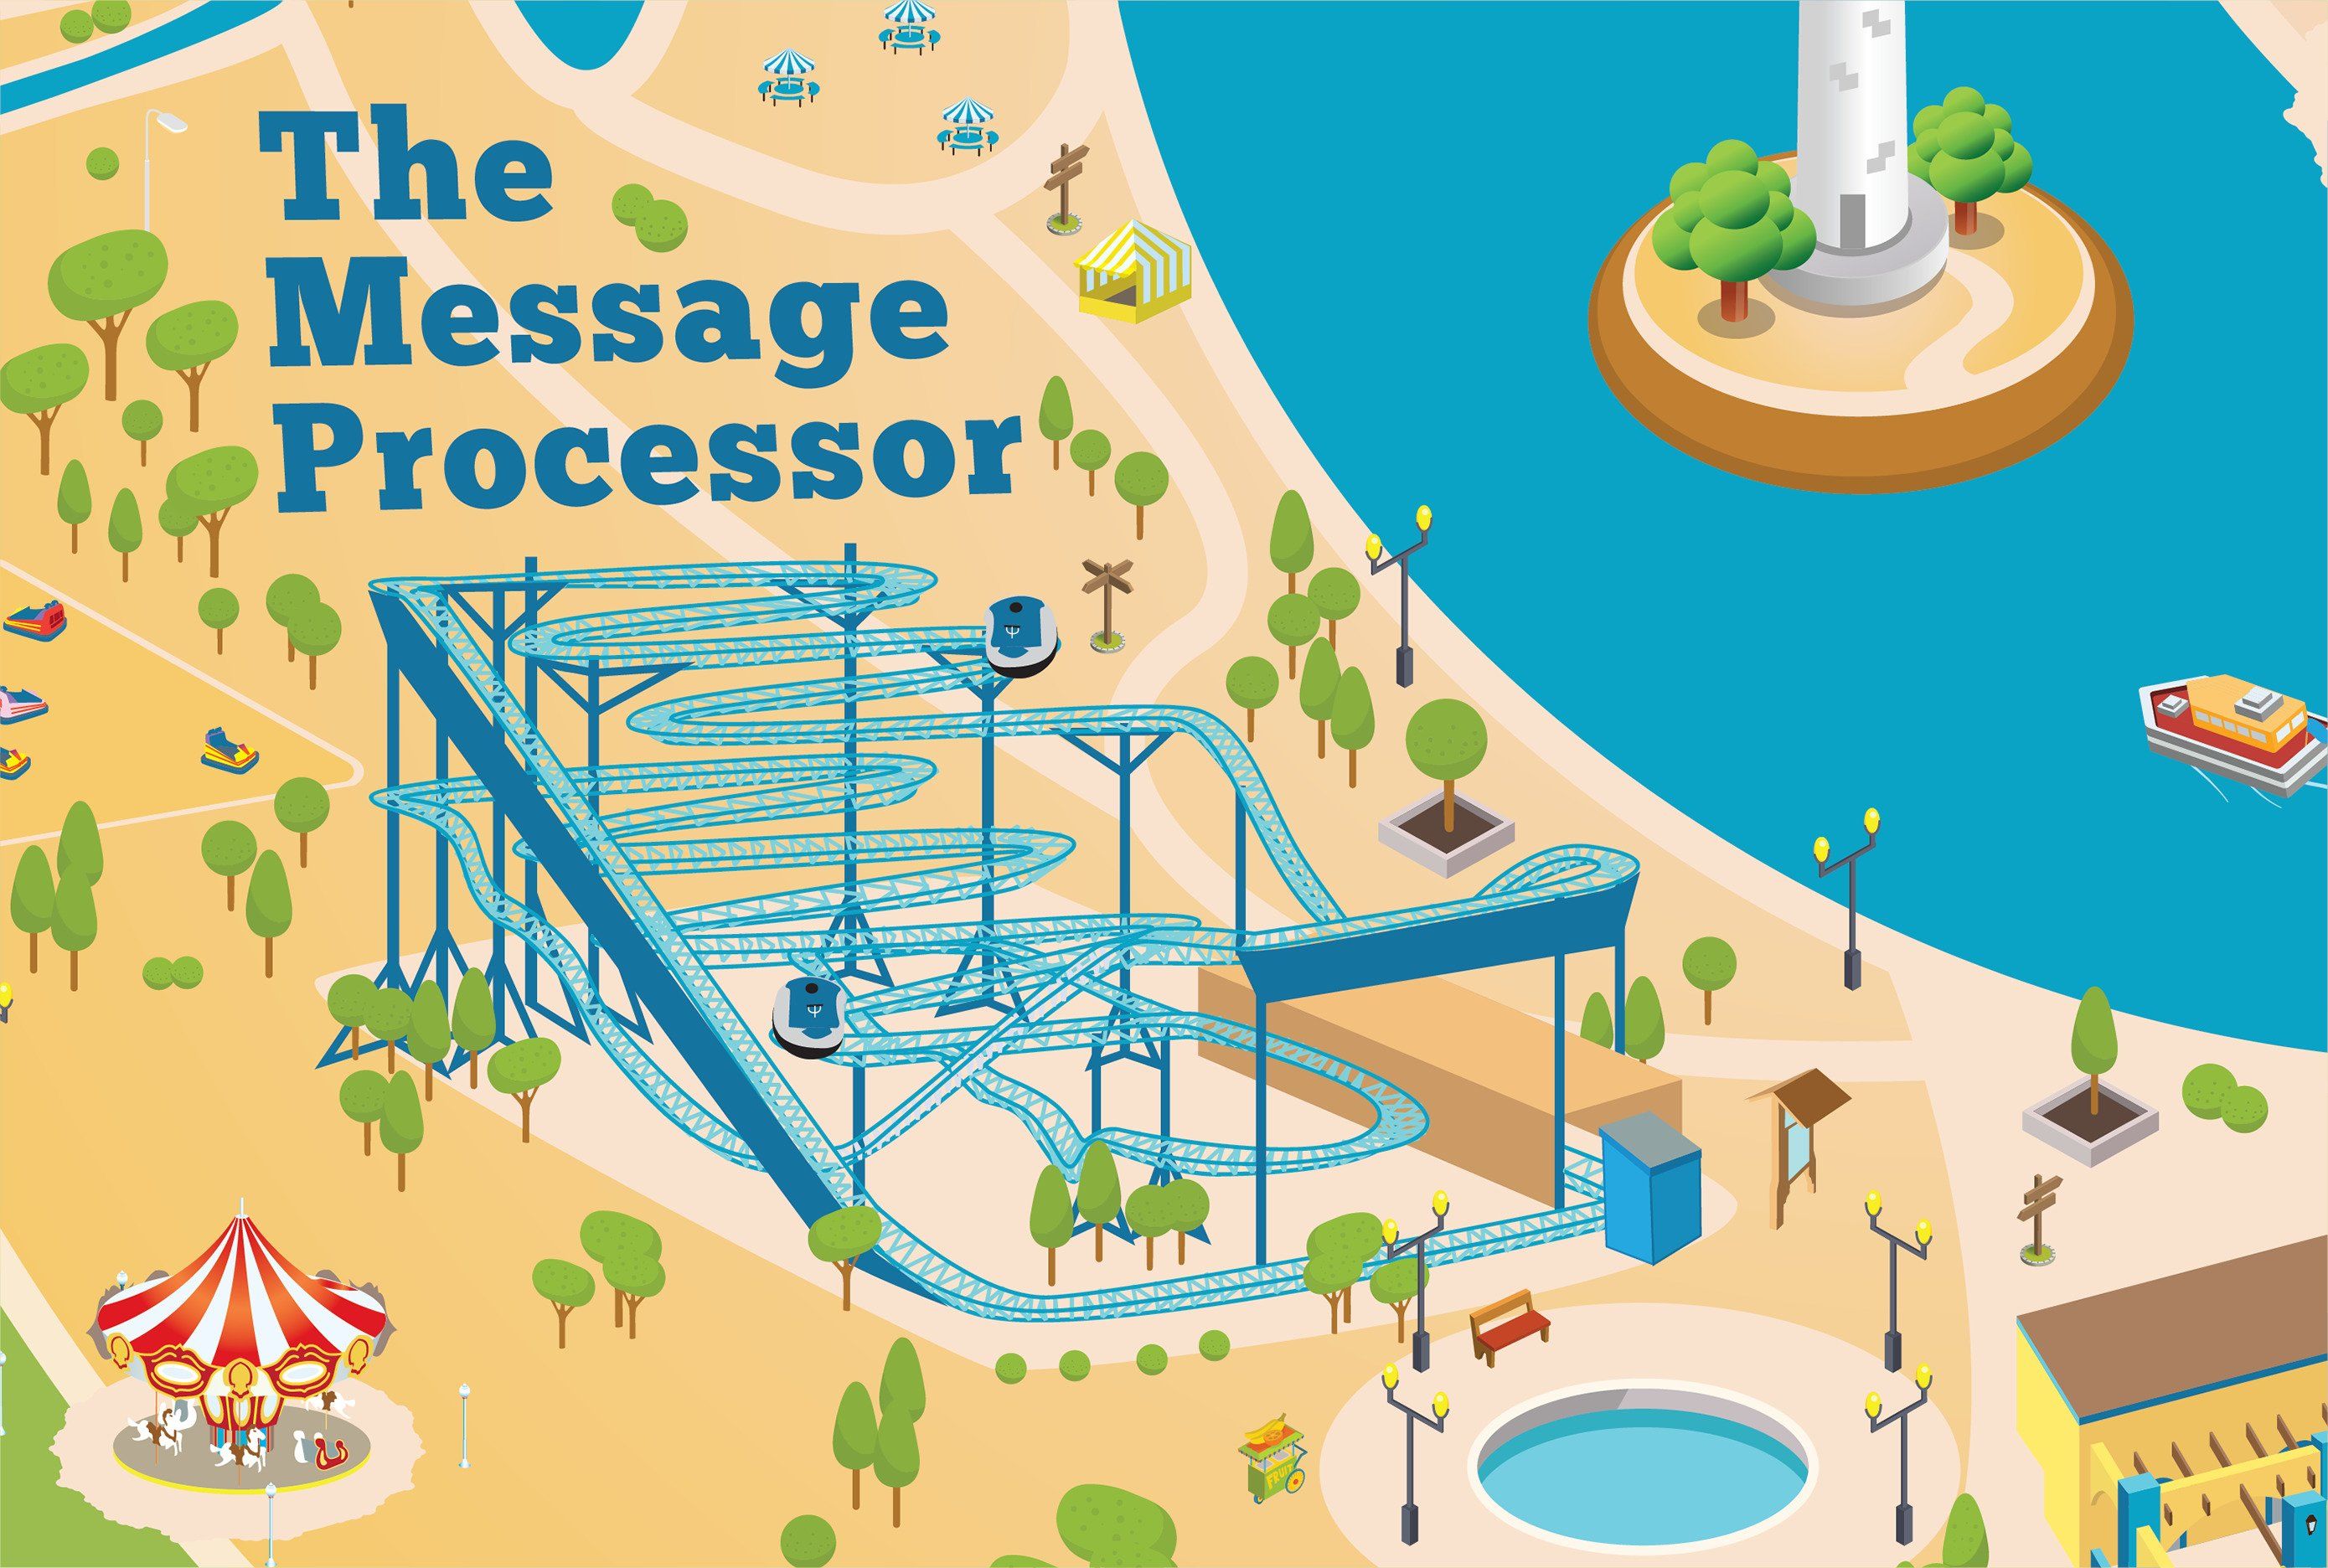
When we first opened, the Message Processor had a single car, and each ride took 20 seconds. Going at this speed, the Message Processor could handle 3 passengers per minute.

After a while, the Message Processor started to slow down. These days, a single ride takes 30 seconds. That means our throughput has gone down to 2 passengers per minute, so we can’t serve as many people as we could before. That’s a problem.

There are a couple of different approaches we could take to solve it. First, we could bring in a mechanic to try and tune the attraction back to its original speed. If we can get the average ride duration back to 20 seconds, then we can go back to servicing 3 passengers per minute. Alternatively, we could add another car to the Message Processor so that we can have 2 passengers on the ride at the same time. This doesn’t do anything about the duration of each ride (which stays at 30 seconds), but it does increase our throughput to 4 passengers per minute.

Eventually, we won’t be able to add any more cars to the Message Processor. We’ll need to open a second track, a copy of the Message Processor, to our theme park. This has the same effect on ride duration and throughput as adding another car but obviously comes at a much higher cost in infrastructure. There are some benefits, though. Now we can close one of the Message Processors for maintenance while still letting people ride the other one.
On a rainy (low traffic) day, our theme park will have fewer visitors. Even though the Message Processor retains the same ride duration (30 seconds) for a potential throughput of 120 rides per hour, there may only be 20 passengers in a given hour (actual throughput). As you can see, the throughput is heavily affected by the number of incoming passengers but is limited by the ride duration. The shorter our ride duration, the higher our potential throughput. It’s important to monitor throughput and ride duration together. In fact, if we can predict when our throughput will be low, it’s a great opportunity to close the Message Processor and get that mechanic in.
When monitoring messaging systems, we also measure how fast messages are getting processed. Instead of ride duration, we measure processing time, which is how long it takes to process a single message. Processing time heavily influences the maximum throughput that a component can achieve. In order to maximize the number of messages a component can process, we need to minimize the time it takes to process each individual message.
When we start to hit the maximum throughput of a component, we can try to optimize a specific message handler (reducing processing time). But that may not be enough if, for example, the constraint is an external resource like a database or third-party web service. Eventually, a second copy of the component may be required (scaling out the process).
🔗Which attractions have the longest line?
The second attraction that we added to our theme park is a waterslide called Critical Splash.
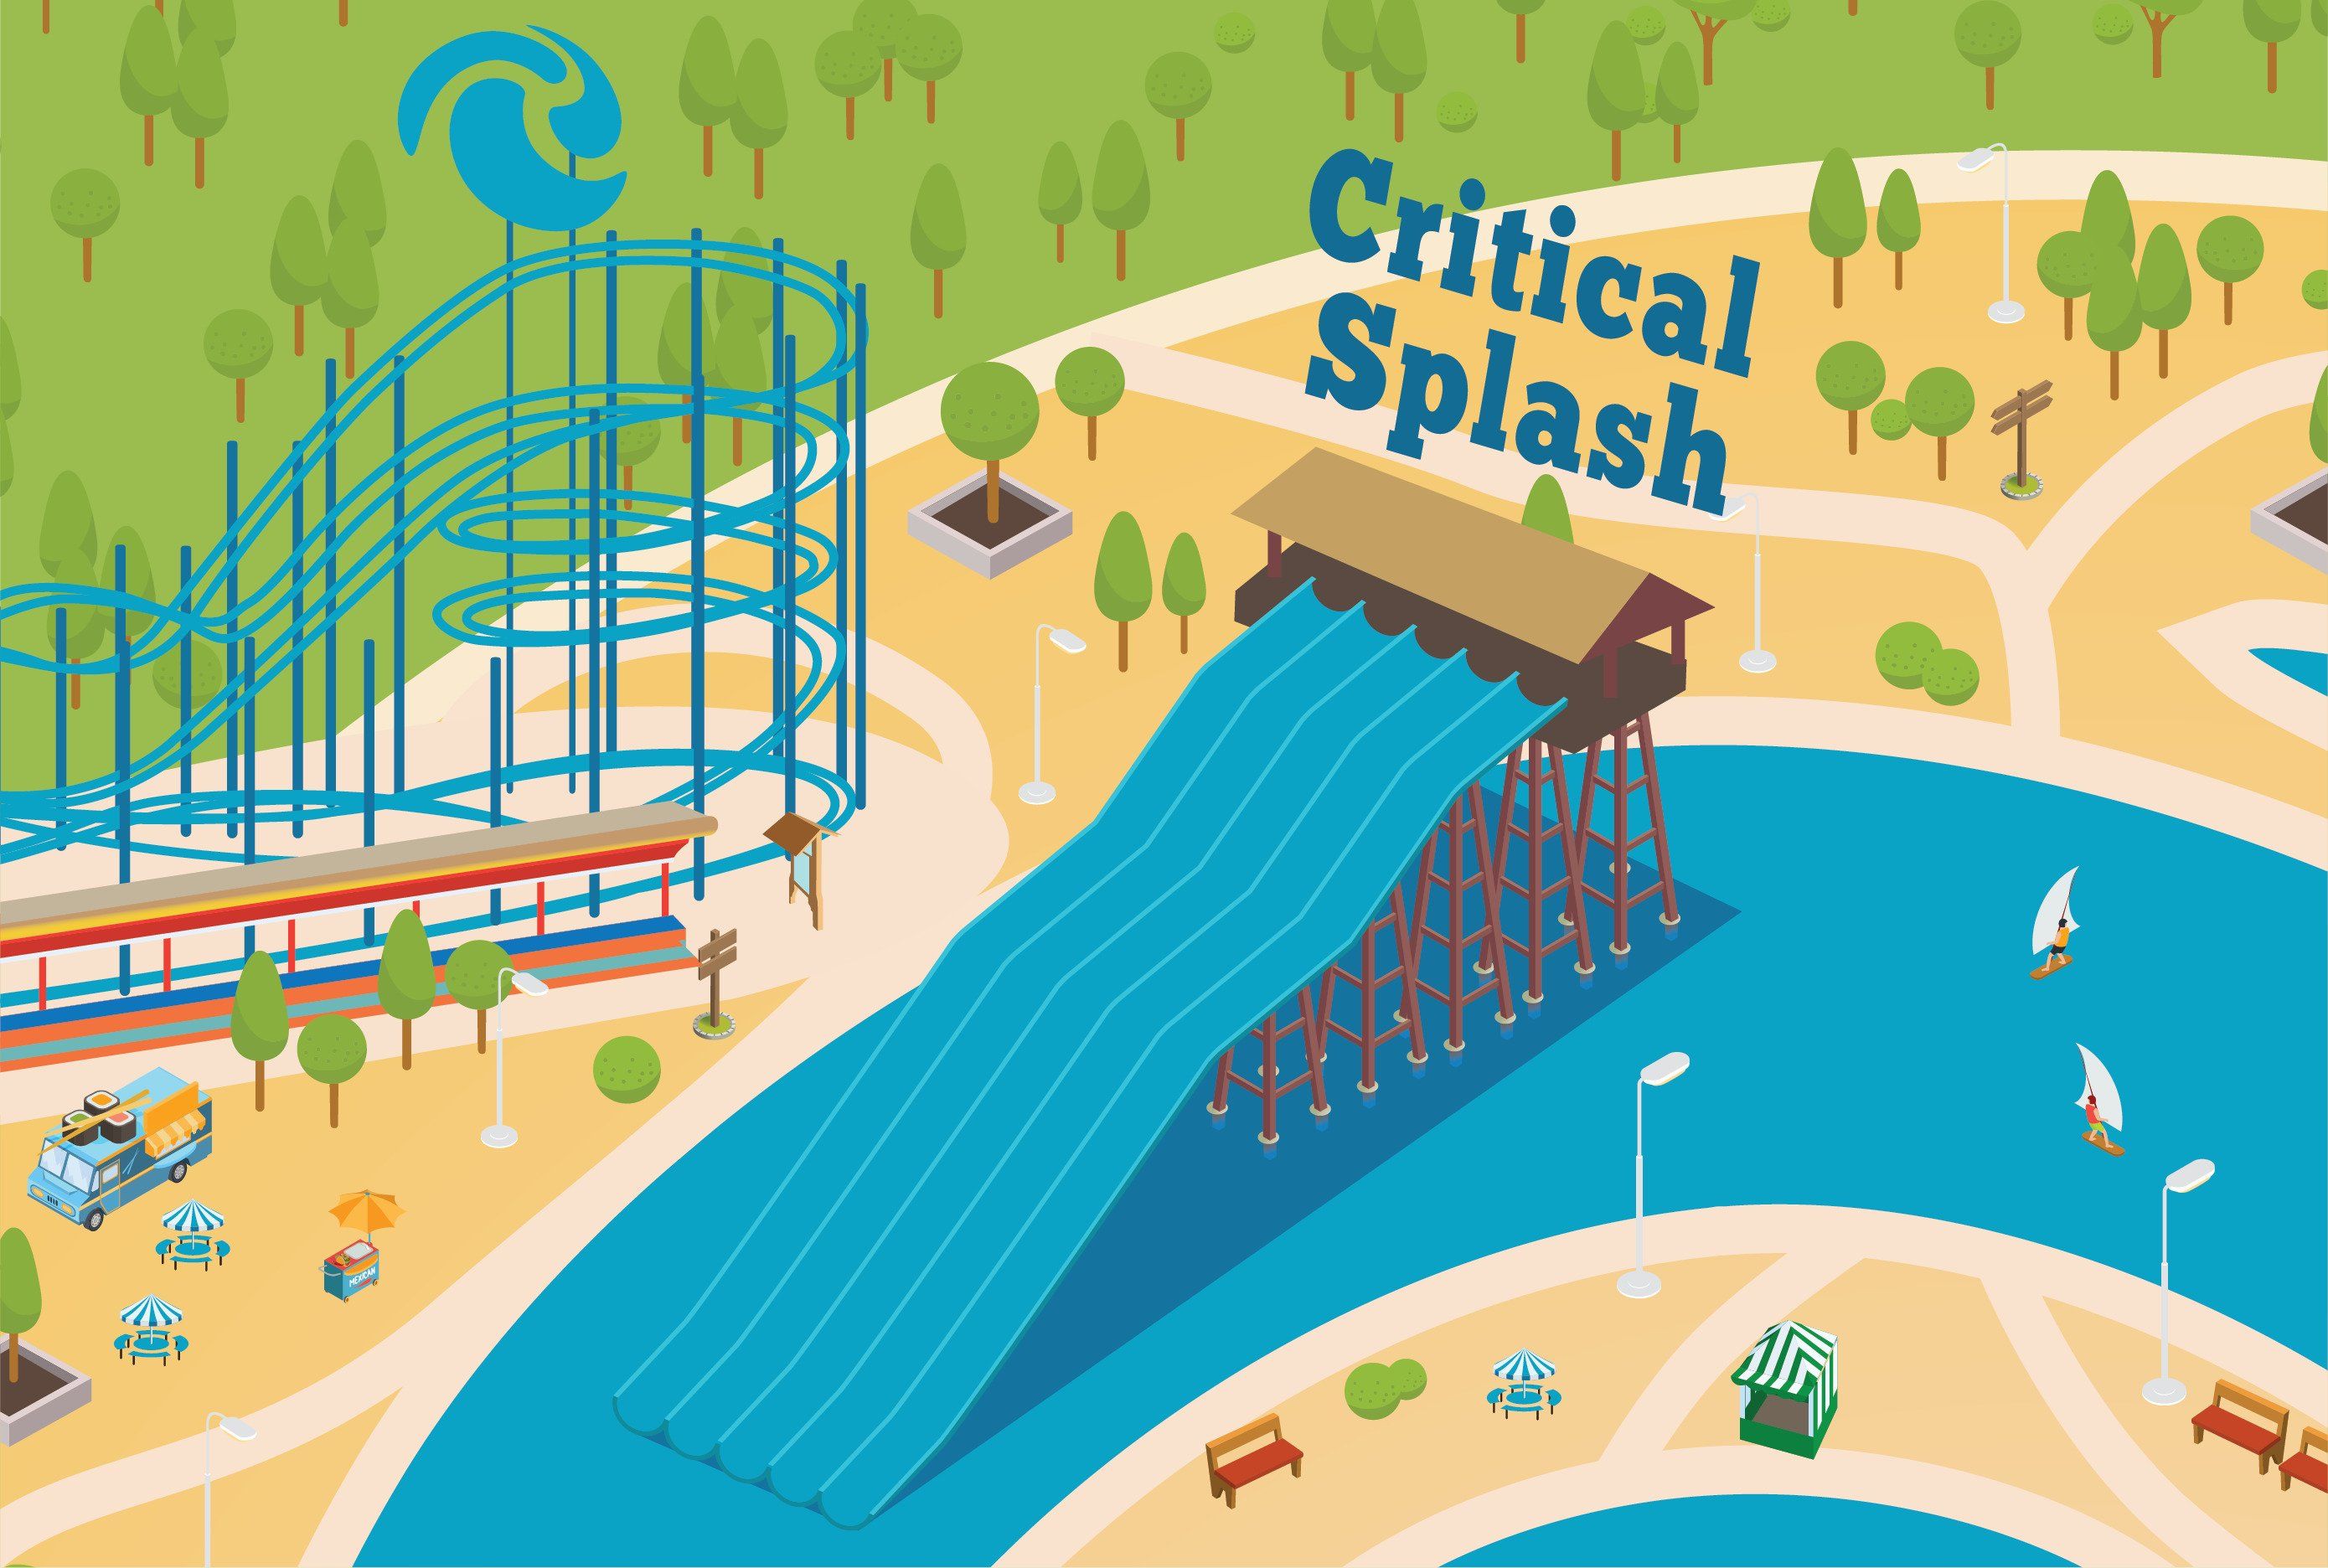
Whenever someone wants to ride the Critical Splash, they walk up the stairs to the top, and as long as there’s a clear slide, they can jump straight in and ride it to the bottom. If there isn’t a clear slide, they’ll wait in line until a slide clears up.
During the day, the length of the line for Critical Splash shrinks and grows as demand shifts. A shrinking line is better since that means the attraction is serving visitors faster than they’re arriving. But is a growing line cause for alarm?
In short bursts, a growing line length usually isn’t a problem. During the summer, for example, it’s common for a busload of visitors to arrive at the park and all jump in line for Critical Splash. If we’re monitoring the line’s length for Critical Splash, we see this as a sudden spike in traffic which will eventually (we hope) go away naturally as the day progresses.
After an hour, if the line is still growing, then it might be time to take action. We need to increase the throughput of the attraction to shorten the line faster. We can do that by opening more slides (increasing concurrency) or by opening another instance of Critical Splash (scaling out the process) somewhere else in the park. We could also try to decrease the ride duration but it’s pretty hard to make a waterslide go faster!
🔗“I can’t wait to get on the ride”
Something else we want to measure for Critical Splash (and indeed, for any attraction) is how long people spend waiting in line. Waiting around in line is boring, so the longer the line is, the more time our visitors will spend being bored. If we want to keep the wait time short, we need to keep the throughput high. And to do that, we need to keep the ride duration short.
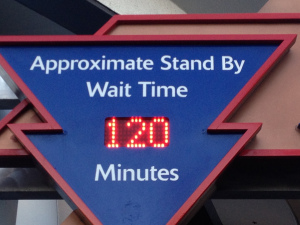
If we want our theme park to be successful, we need to watch for increasing line lengths and wait times and take appropriate action to keep our lines under control and keep people moving.
We can monitor the “lines” (i.e., queues) of messaging systems with the same thinking. If the queue for a component spikes over a short period, that’s something to keep an eye on. If it keeps going up over time, then action should be taken to increase message processing concurrency or to scale the component out.
For messaging systems, we measure critical time, which is the time between when a message is sent and when it’s been completely processed. This takes into account the time it takes for a message to get from the sending component to the queue, how long it waits to get to the front of the queue, and how long it takes to be processed. The critical time metric for a component gives you a quick overview of how responsive that component is. In other words, if I send it a message now, how long will it take for it to be handled? A high critical time is a good indication that it’s time to scale a component out to help it handle its backlog of messages.
🔗Don’t get your tickets just yet
I’ll let you in on a secret: we didn’t really open a theme park. But by now, you’ve probably realized where we’re going with this post, which is to highlight the importance of going beyond infrastructure monitoring in your distributed systems.
To be clear, infrastructure monitoring is extremely important. Any park manager would want to keep track of the water and electricity usage of the park and even see a breakdown for each attraction. A spike in water usage might indicate a leak somewhere and that needs to be investigated, and tracking a steady increase in electricity usage lets you plan when you need to add more power lines. The paths between attractions need to be kept clear to allow visitors to move from attraction to attraction quickly.
When it comes to your distributed system, you should be using infrastructure monitoring in the same way. Sustained increases in RAM usage can indicate memory leaks, steady increases in storage can be extrapolated to determine when larger disks are needed, and network pathways need to be monitored to ensure that your components are able to communicate effectively.
But once your infrastructure monitoring is in place, don’t forget to add on application monitoring to provide you with a deeper insight into how your components are behaving. It’s important to know which components are running slow, which have large backlogs of messages to process, and how those backlogs are changing. This can help you diagnose issues quickly and can even provide clues on how to fix them. It can guide you to tune your components to ensure that messages spend less time waiting to be processed, keeping your system as a whole responsive.
If your system is built on top of NServiceBus, our new NServiceBus.Metrics package already calculates these key metrics for you. All you have to do is plug it into your endpoints. Check it out.
About the author: Mike Minutillo is a developer at Particular Software. His favorite theme park attraction is Space Mountain at Disneyland California. Space Mountain has an average processing time of 3 minutes, and even on a slow day, you’re likely to wait in line for 45 minutes.


 Share on Twitter