Usability enhancements in ServicePulse 1.25

One of the challenges in building a distributed software system is that with so many processes doing their own thing, it can be hard to get the bird’s-eye view of what’s going on. Is everything healthy? Is the performance ok? Is there anything going on that could cause a problem?
ServicePulse is our application for monitoring your entire distributed system. It’s where heartbeats tell you if endpoints are healthy or have failed. It’s where our monitoring tools tell you how many messages are in each queue, how long it’s taking to process those message, and if the system is able to keep up with the load or is falling behind. It’s also where you find out if messages have failed processing, see the error (without having to dig through log files), and get the system back on track once the error is fixed.
In this post we’ll tell you about some of the usability enhancements we’ve added in our new version, ServicePulse 1.25.
🔗Managing endpoint instances
First, from the Monitoring page we can now get a quick glimpse at how many instances of each logical endpoint are running in our system.
Here we can see that the Sales endpoint has two running endpoint instances, while every other endpoint is only running a single instance:
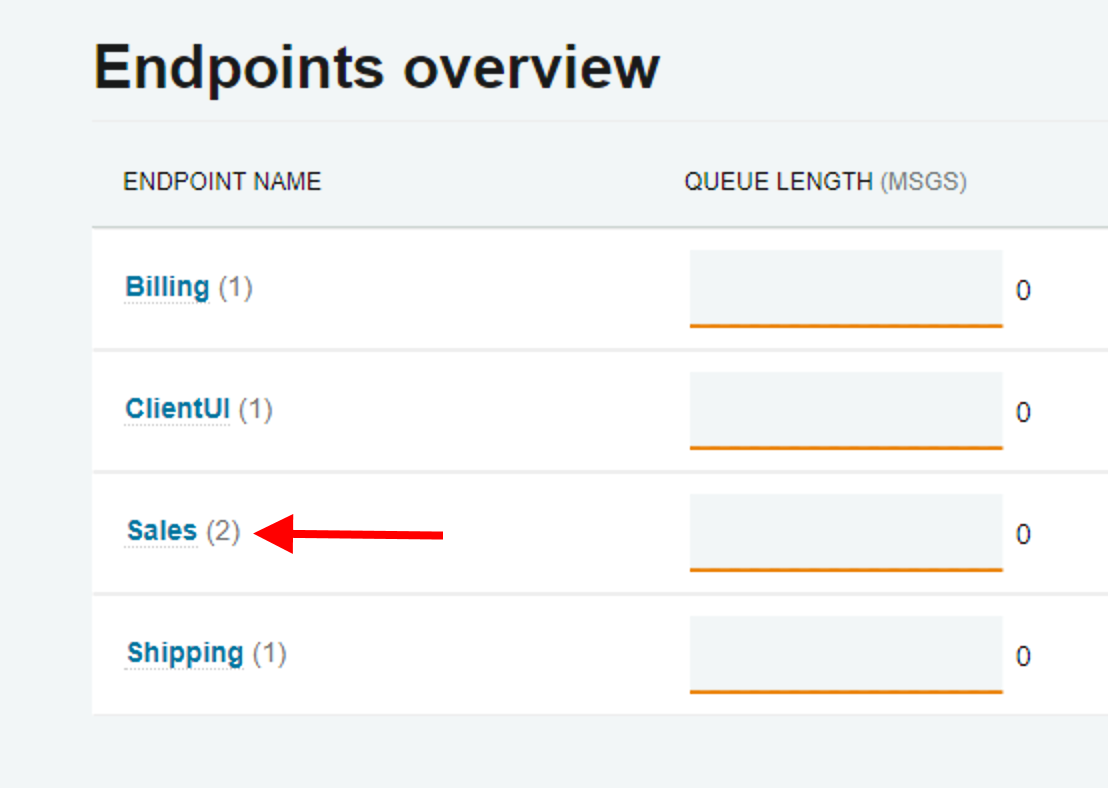
If one of these instances fails and is no longer sending monitoring information to ServiceControl, that number will adjust to 1 to show that you’re only seeing the metrics from one endpoint instance.
When this occurs, you can click on the endpoint name to view the detail, and then below the large summary graphs, click on the Instances tab.
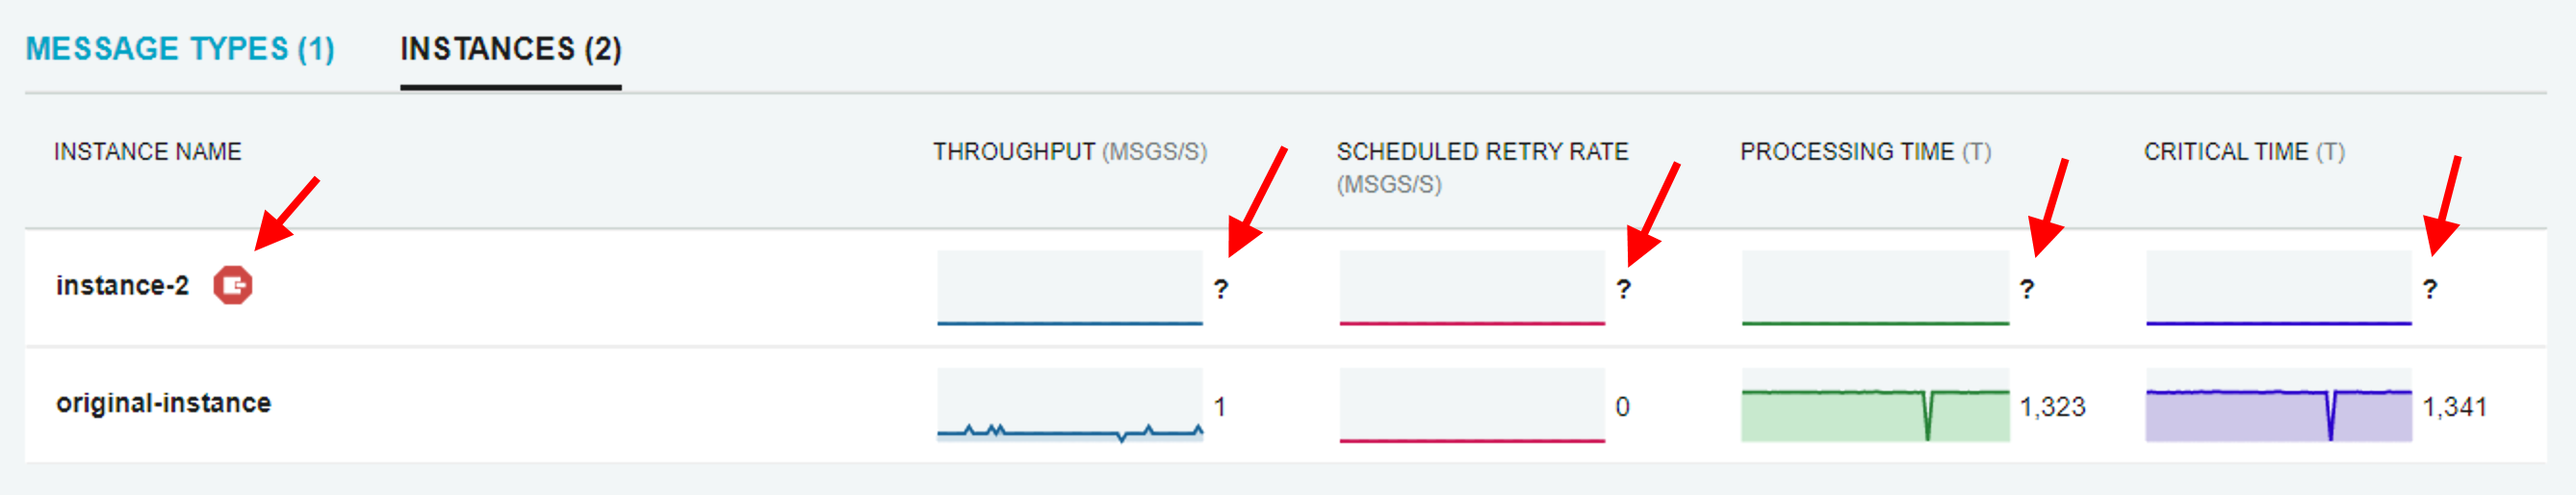
In this case, the Sales endpoint’s instance-2 has failed. If the endpoint has the Heartbeat plugin installed, you’ll also see this failure in the Heartbeats tab.
Sometimes this is expected, especially in a dynamic-scale scenario where additional endpoint instances are added to cover peaks and then later retired. In this case the instance hasn’t failed—you shut it down on purpose. In this case, we want to remove the retired endpoint instance. With ServicePulse version 1.25, now we can.
Hover over the failed instance, and you’ll see a trash can icon, enabling you to remove it:
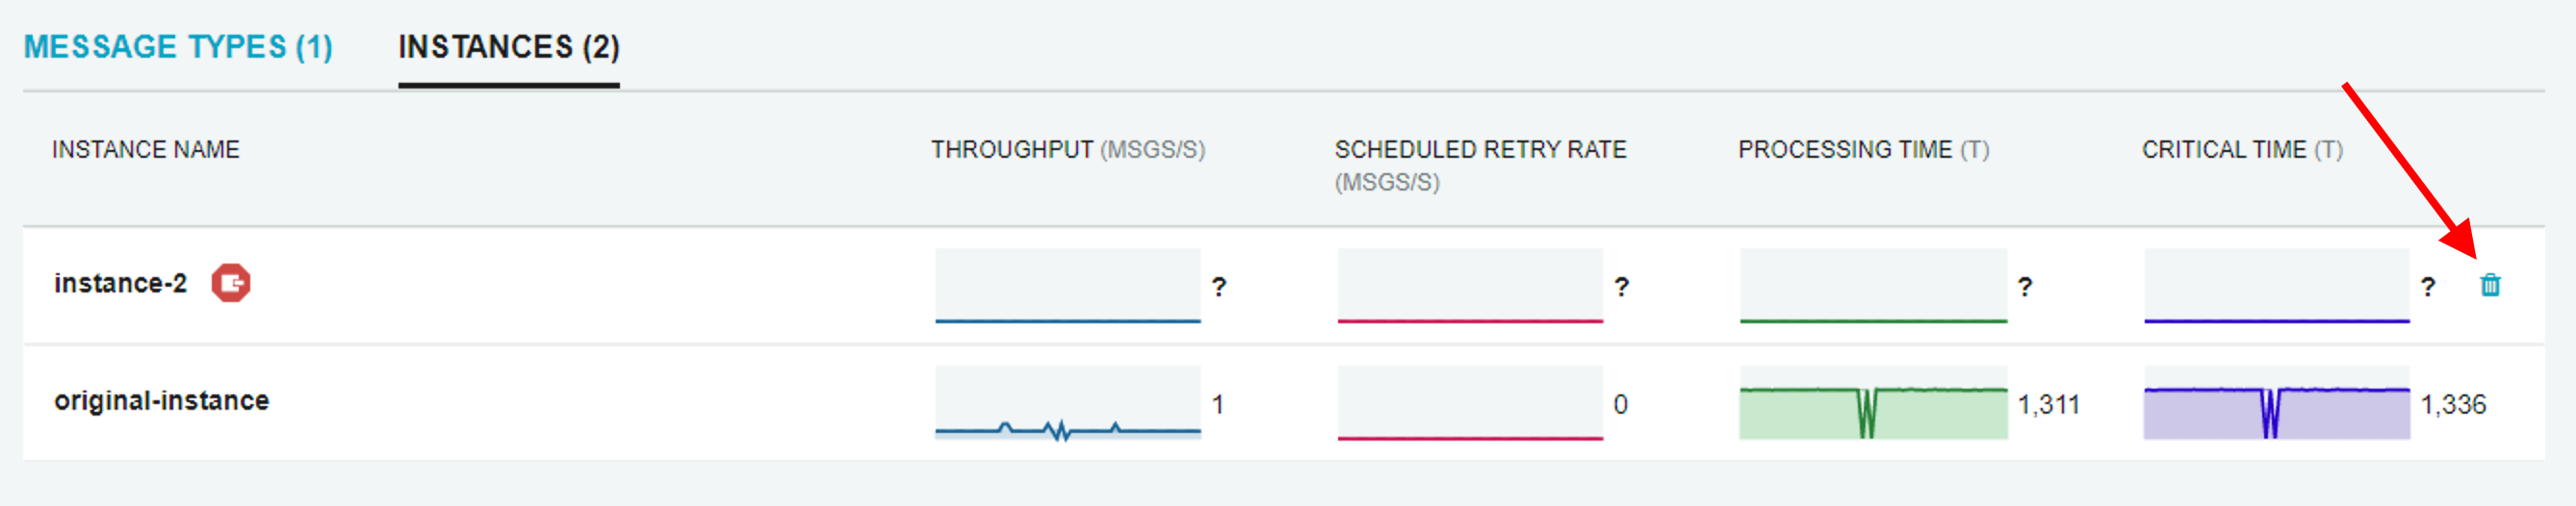
Once the retired instance is removed, the data will return to the graphs on the main monitoring page.
🔗Heartbeats filtered
Complex systems can have dozens upon dozens of endpoints, and scrolling to find a specific one isn’t fun. Some users will organize these by endpoint name into a kind of hierarchy, such as LogicalService.Category.SpecificEndpoint which can help to organize them, but doesn’t always make it much easier to zero in on the necessary information.
In the new version, the Heartbeats page now contains sorting controls allowing you to sort by endpoint name or by last received heartbeat, in both ascending and descending orders, as well as a text filter for the endpoint name.
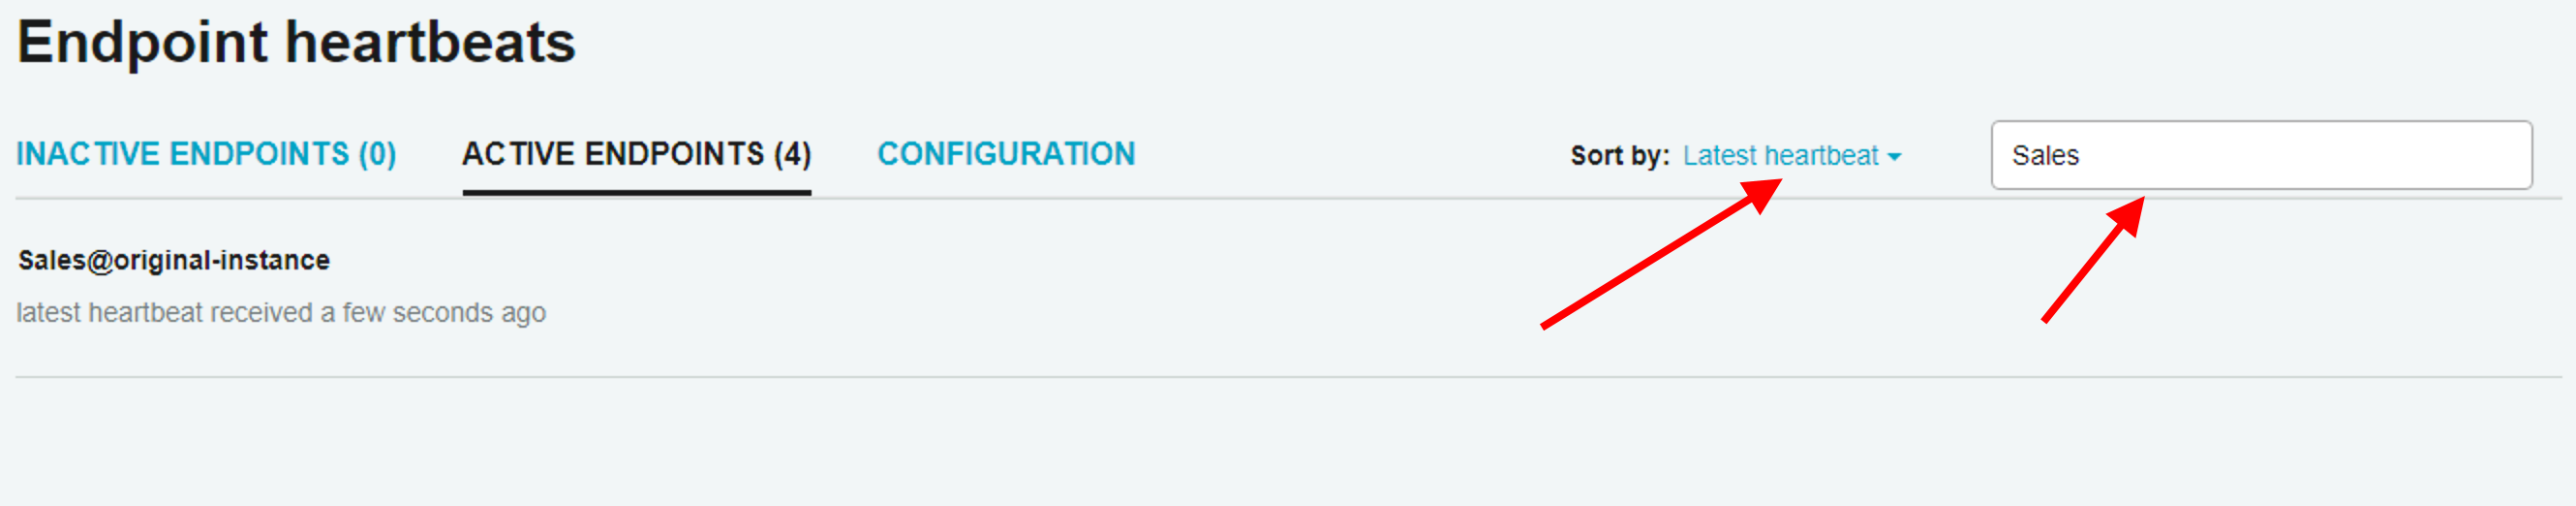
The text filter can make it easy to find all the endpoints within a specific logical service or category if using hierarchy-based names as shown above, and sorting by last heartbeat can make it easy to identify endpoints in trouble.
🔗Failed messages
Failed messages is one of the most powerful features of ServicePulse, presenting failed messages in groups, and allowing you to view the details of the failures and retry messages through their original endpoints.
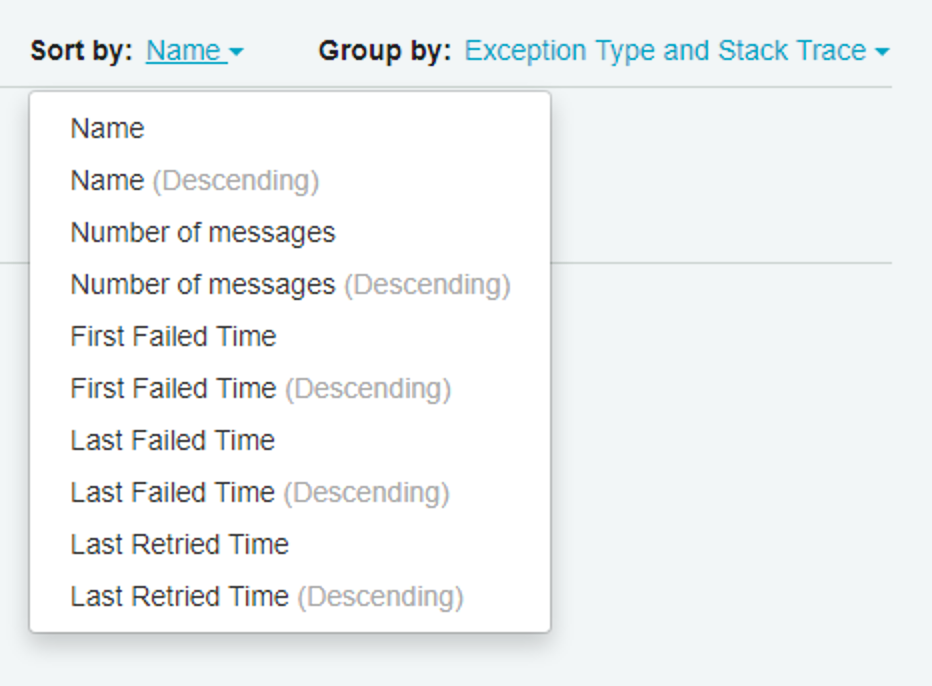
🔗Sorting and grouping
We’ve now added control over how failed message groups are sorted and grouped:
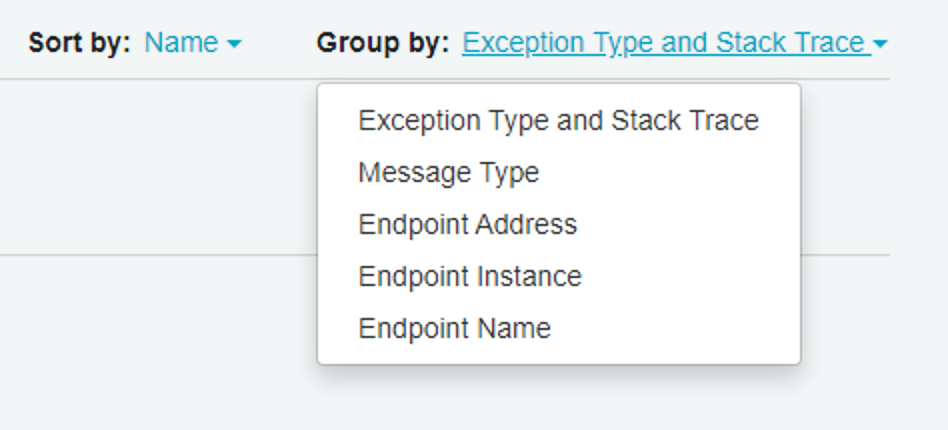
In addition to grouping failed messages, we’ve added the ability to group archived messages in the same way.
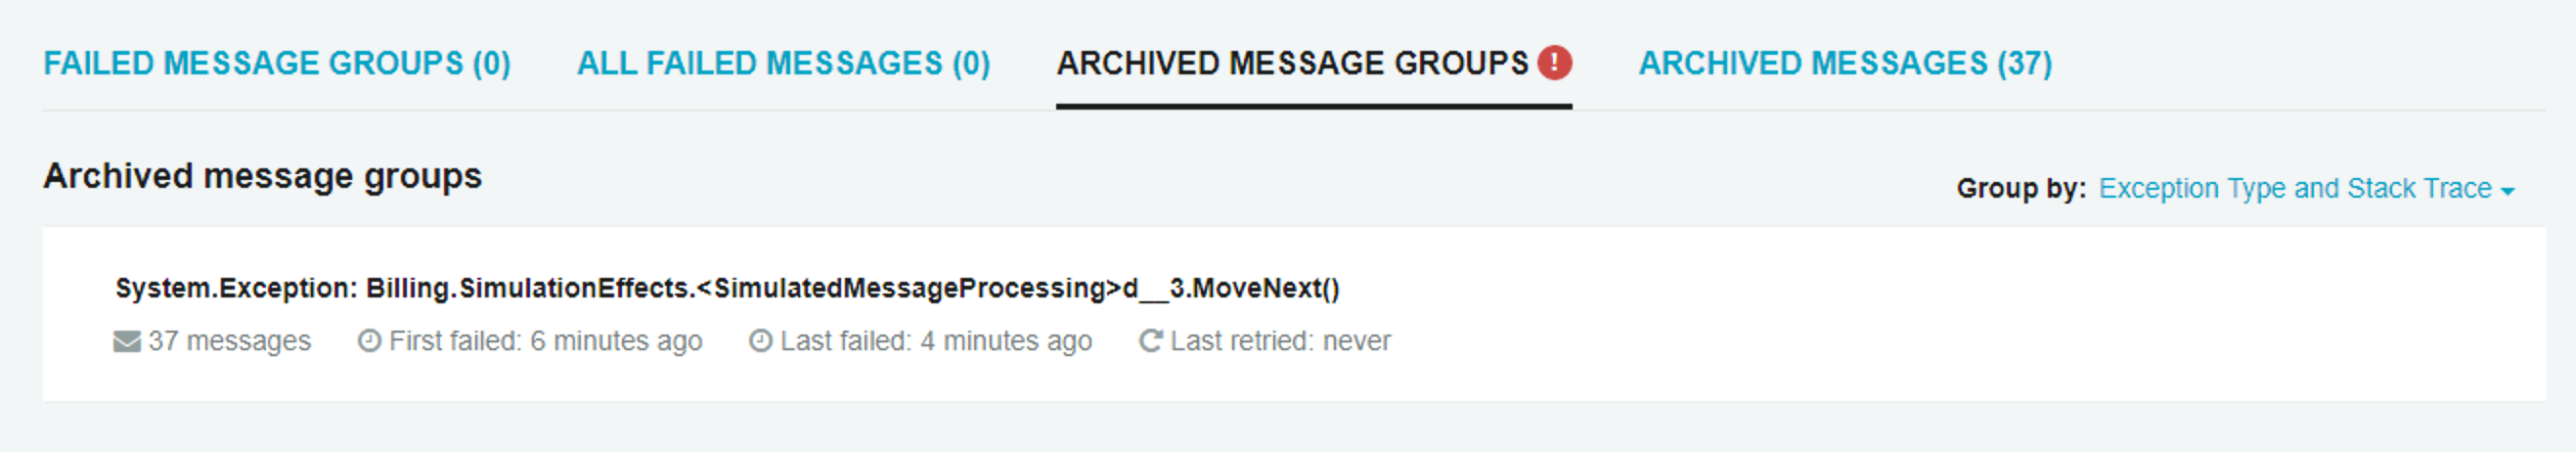
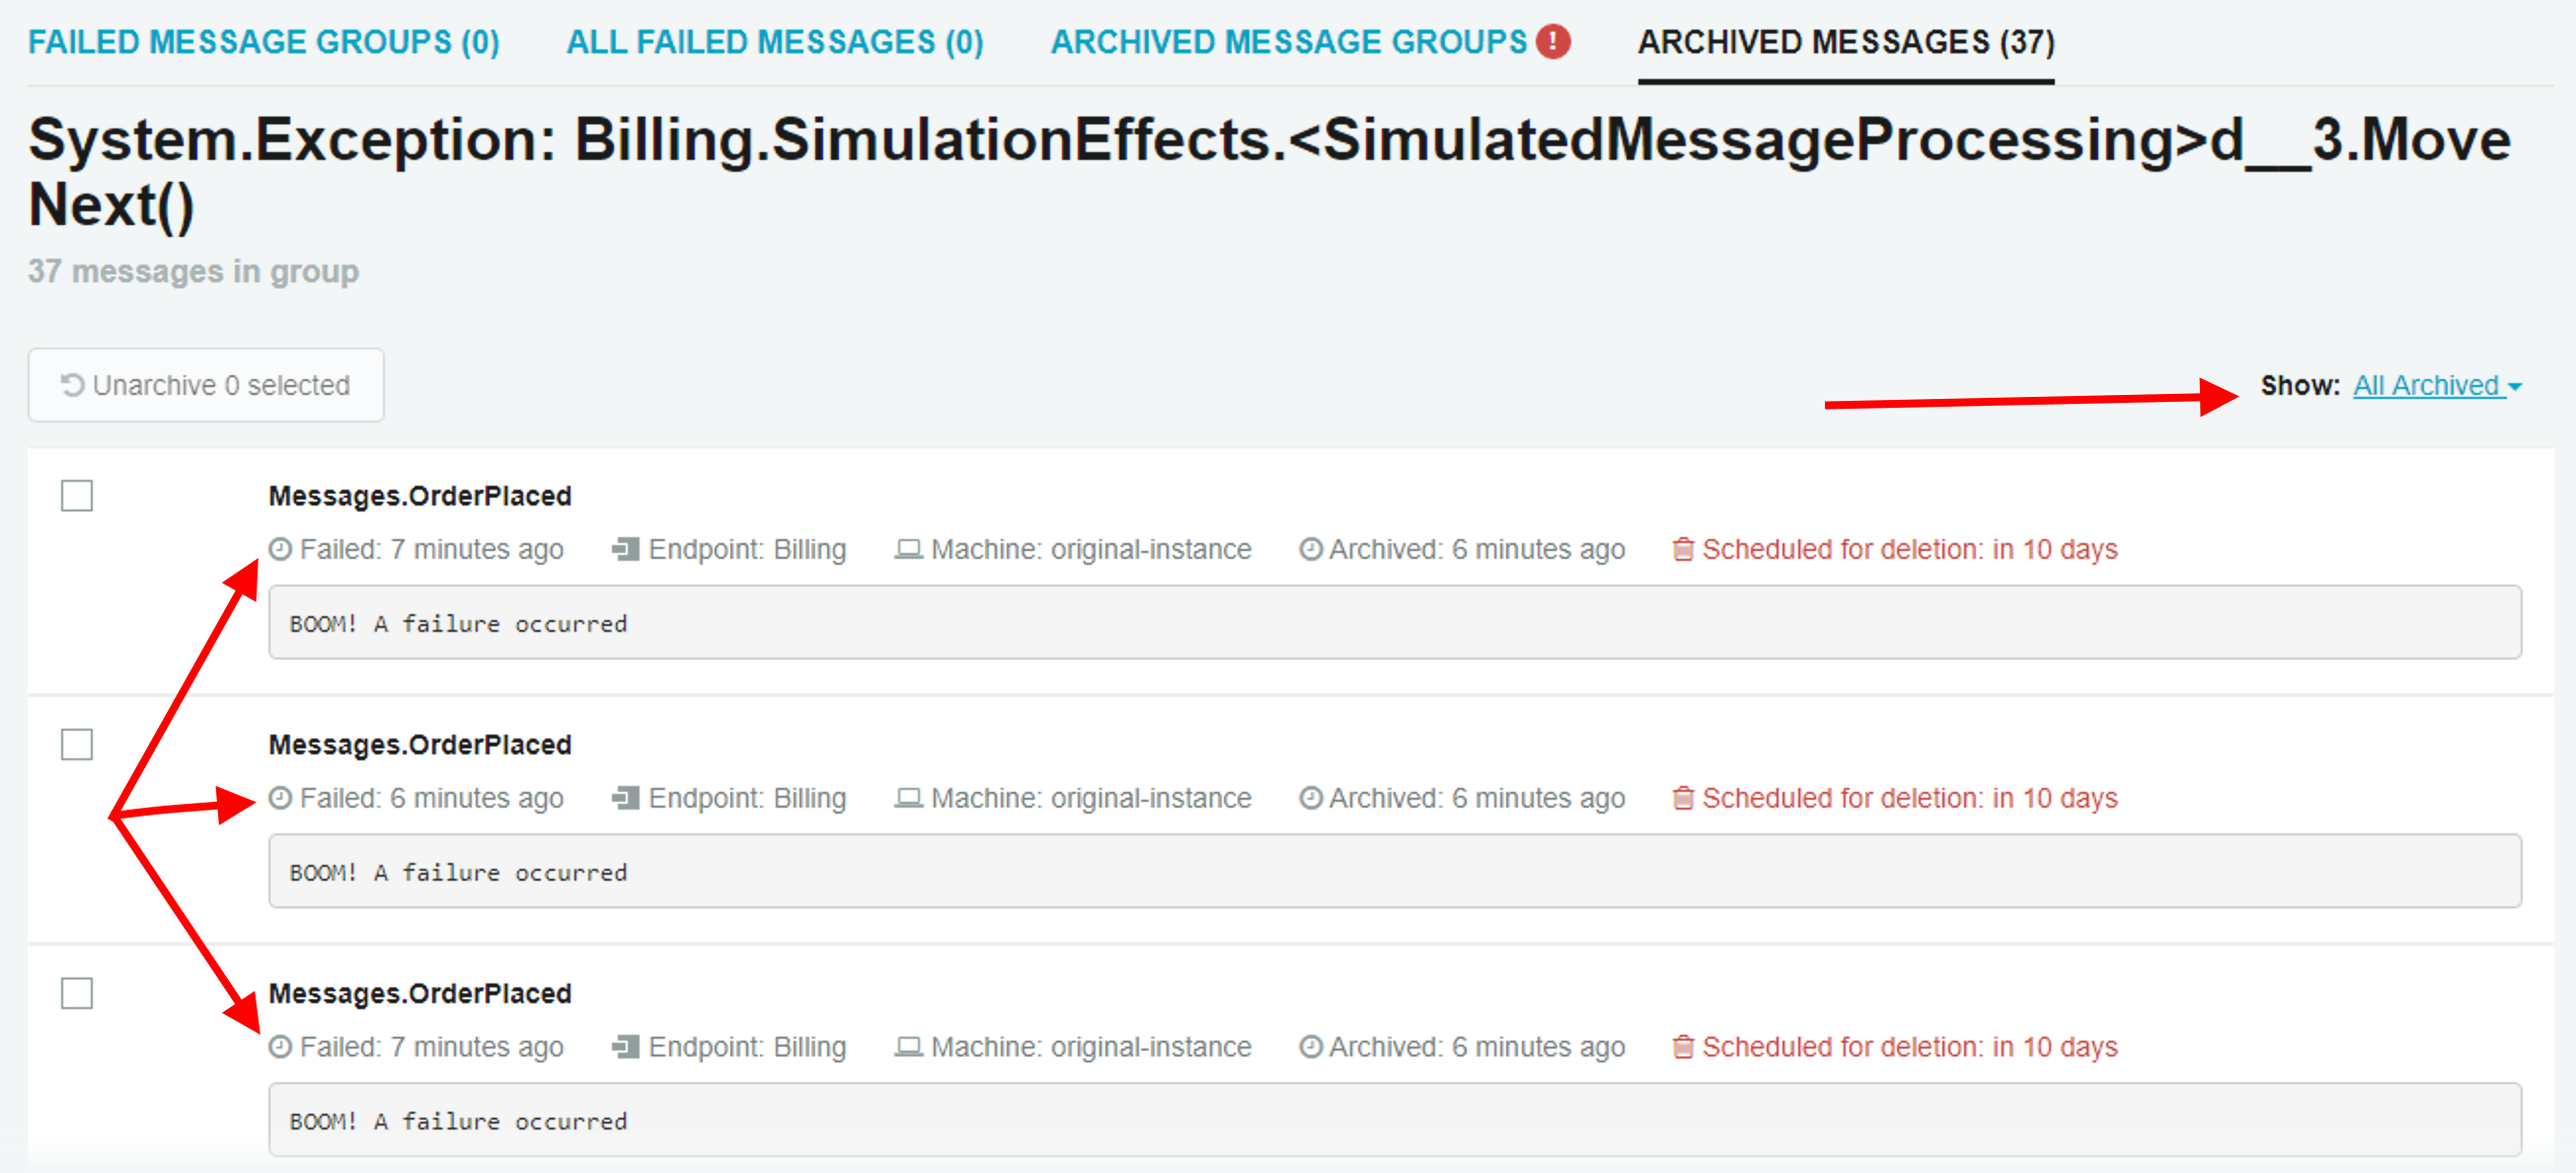
When there are a lot of archived messages, this makes it a lot easier to sort through them in case you need to retry one of the messages or even just to investigate. Similar to normal failed message groups, when you click on a group, you can see the details of each failed message. There are additional filtering controls to only show messages archived within the last two hours, one day, or 7 days if displaying everything is still too much.
🔗Quick access to details
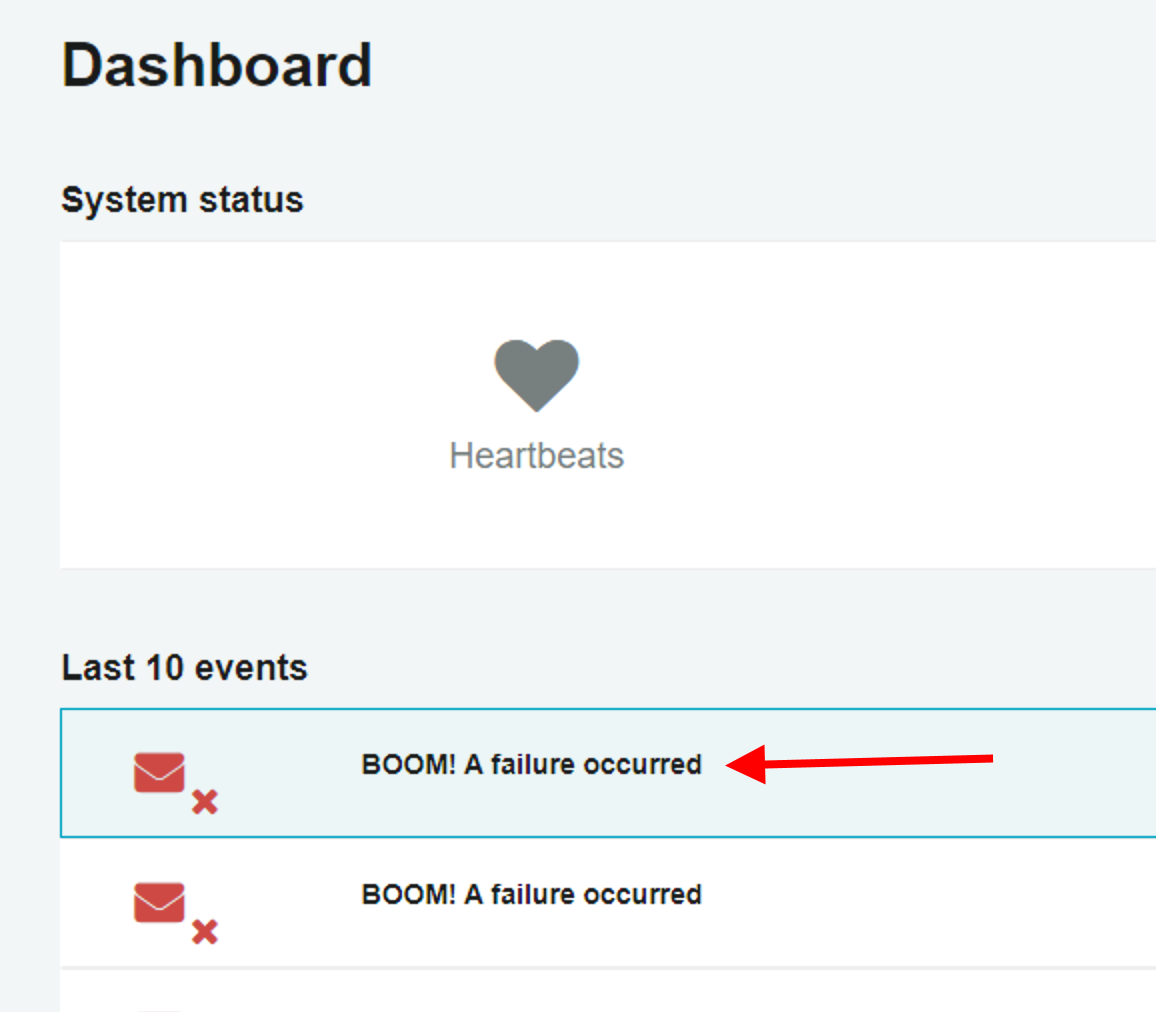
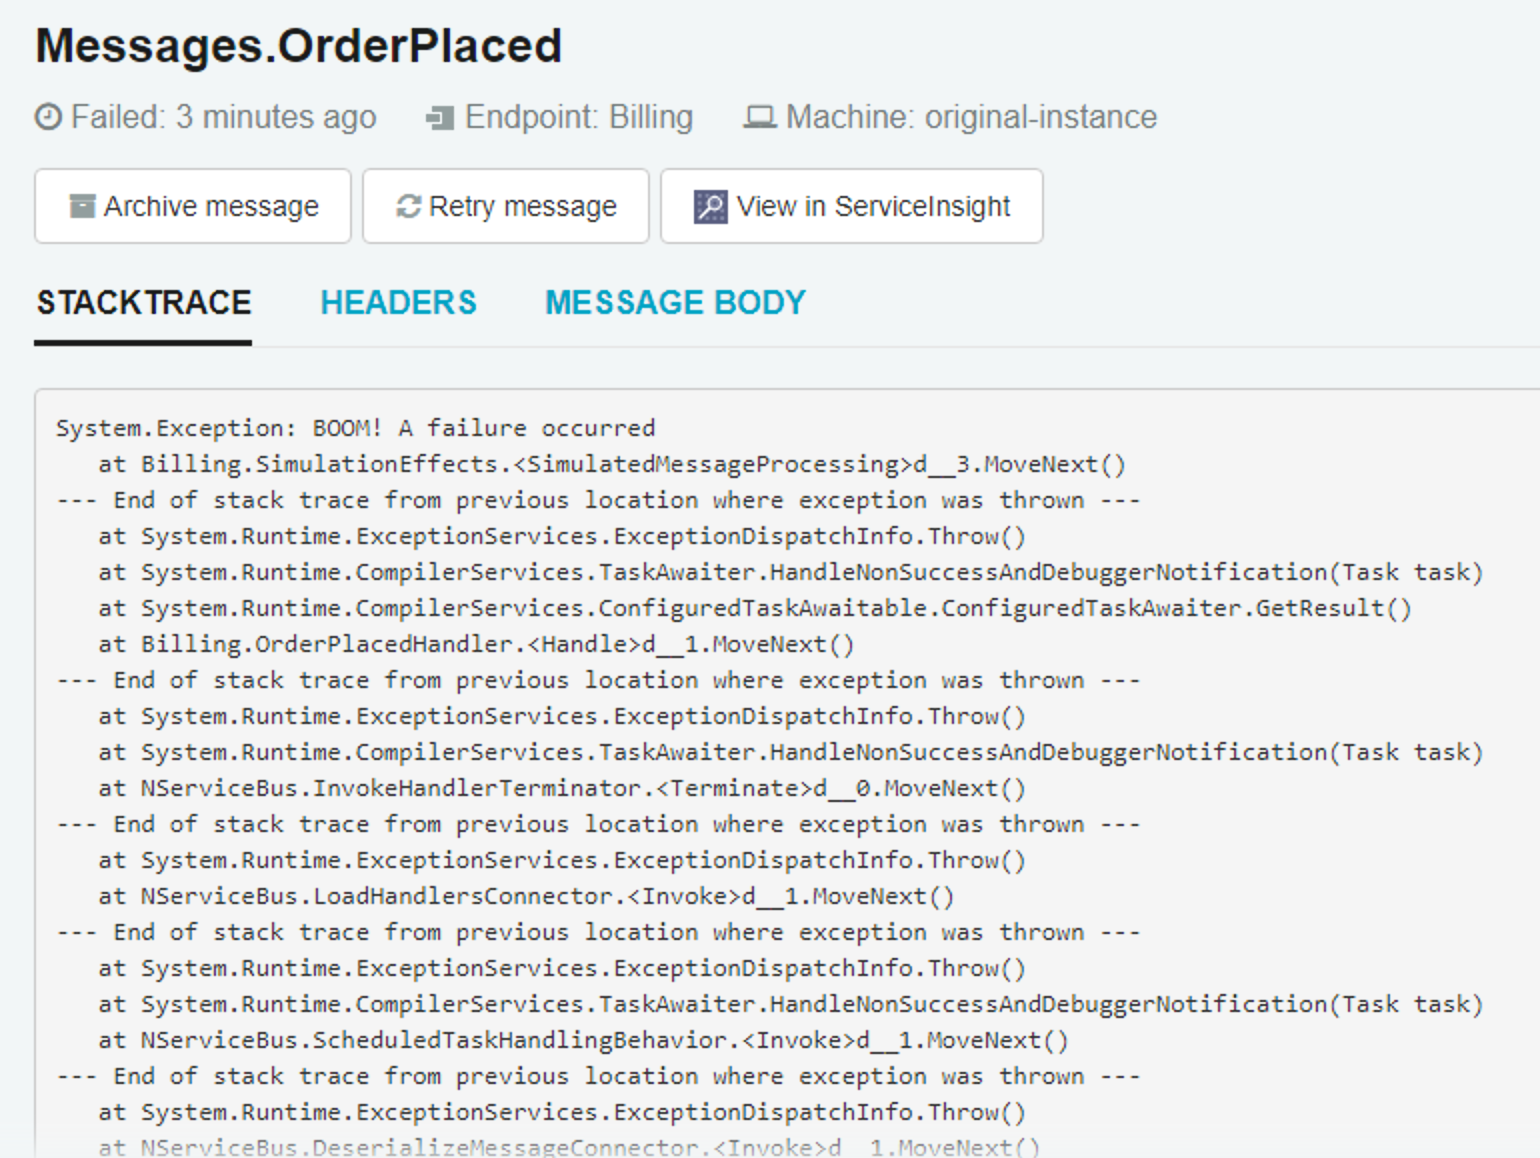
Finally, for failed messages, if you click on a failed event message from the Dashboard or Events page, now it will take you directly to the details of the failed message.
🔗See all events
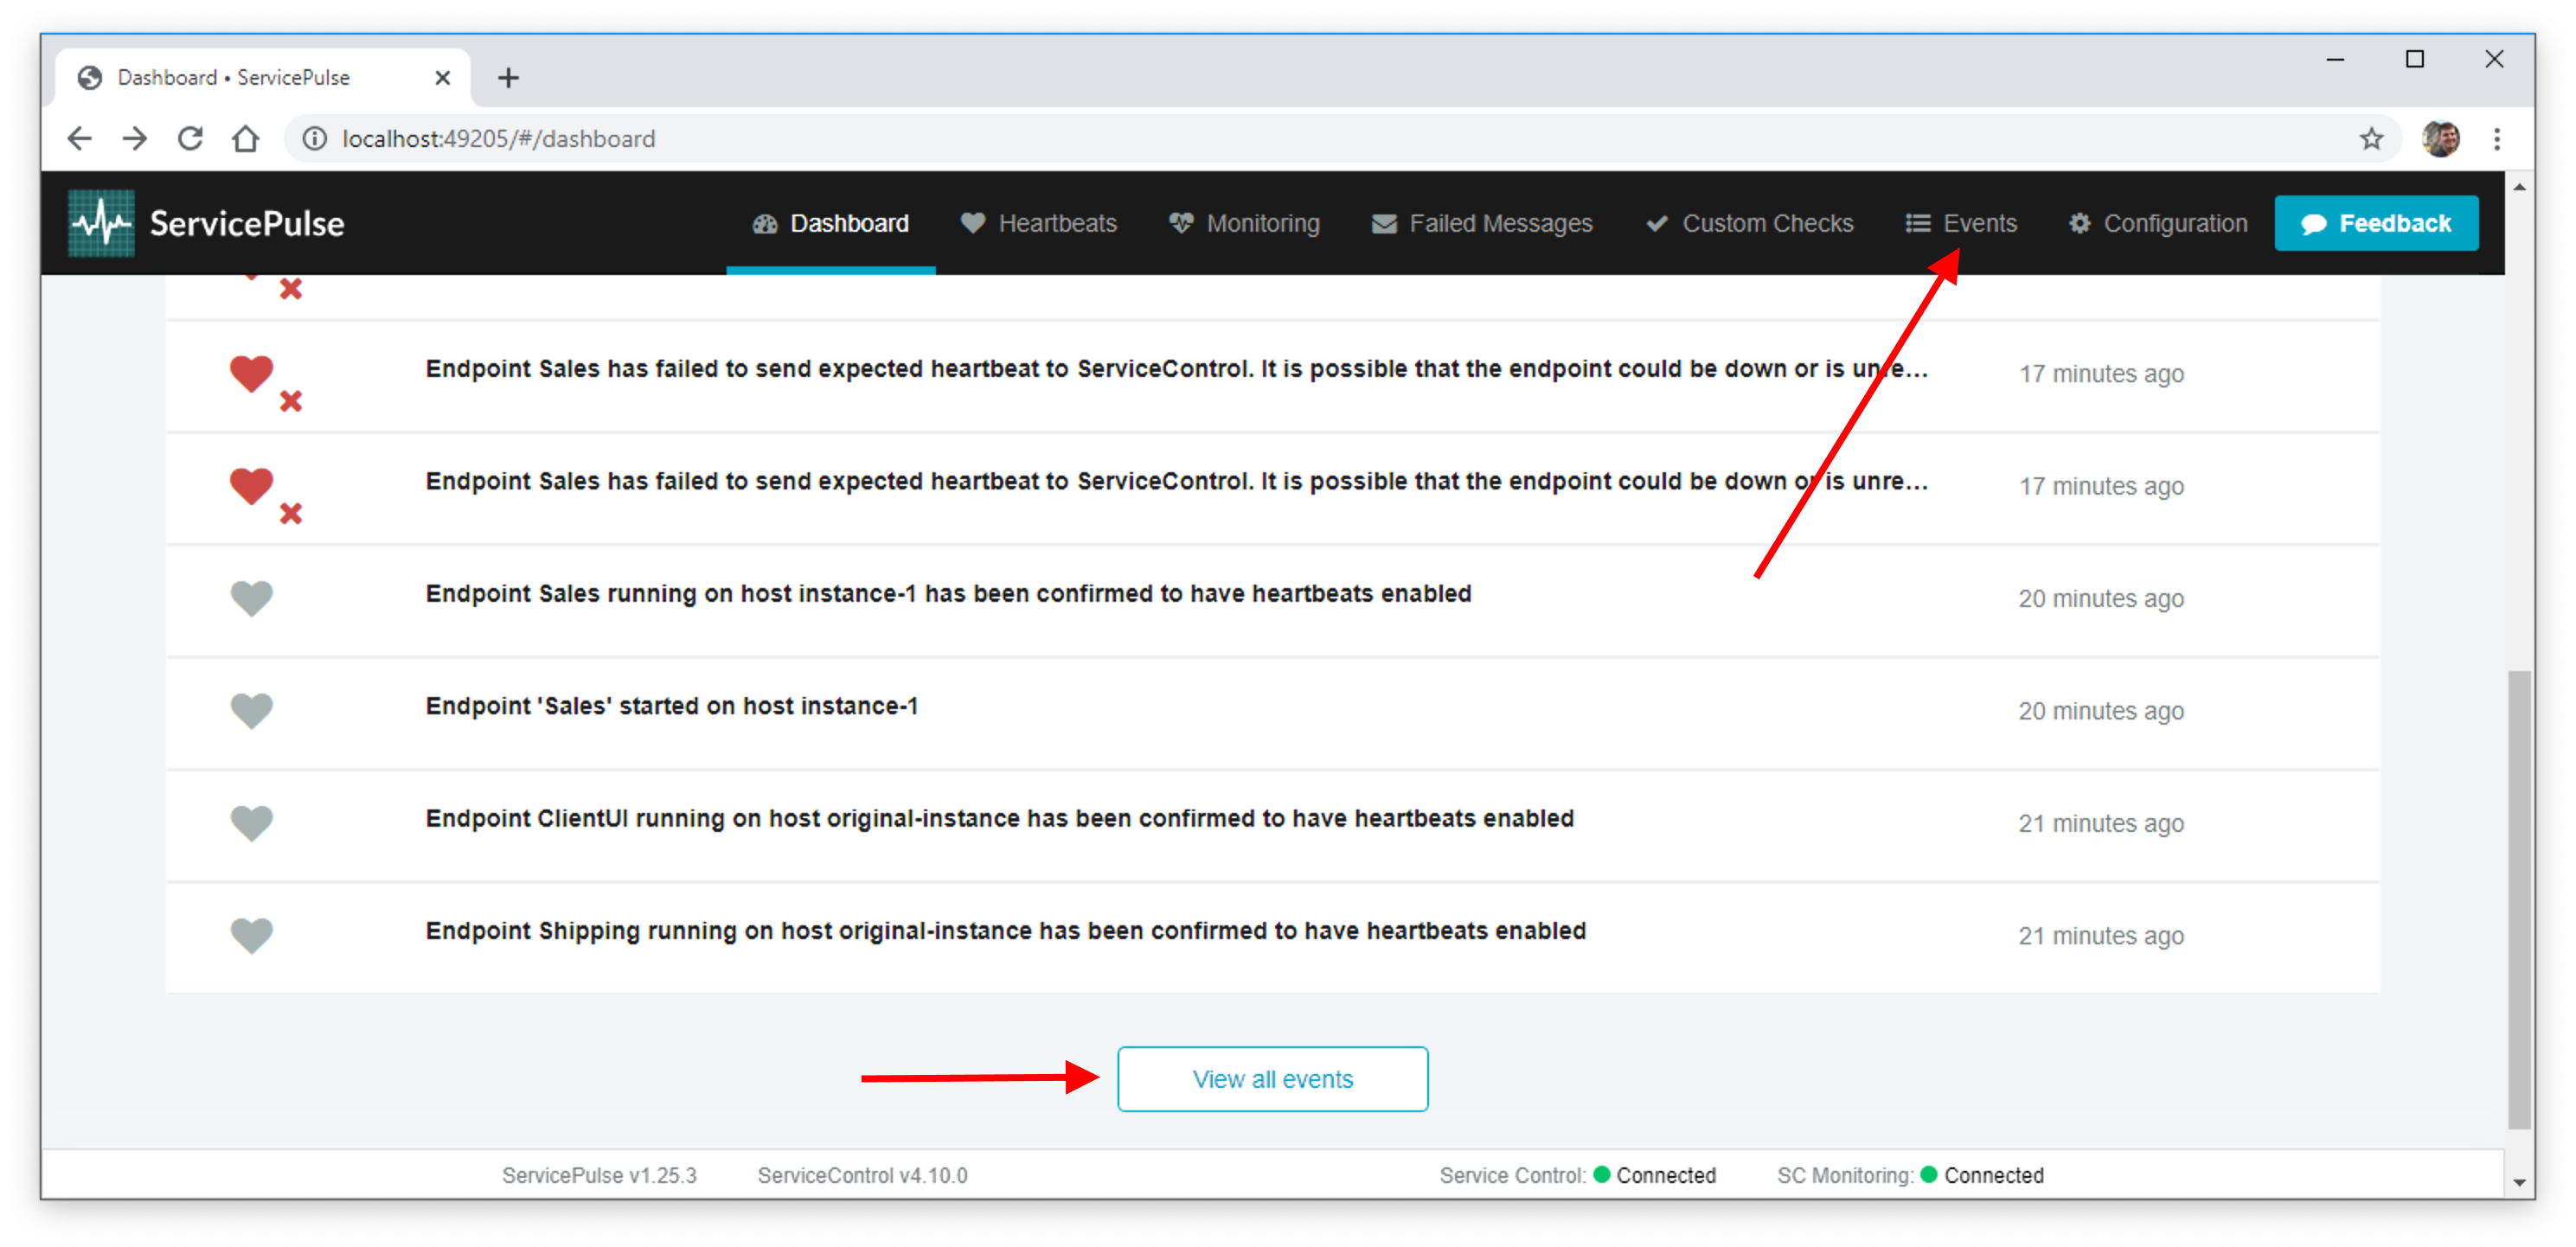
The Dashboard page has always shown you the last 10 monitoring events that have happened in your system. This includes things like endpoints starting and stopping, confirmed heartbeats, failures to receive heartbeats, failed custom checks, etc. However, in a busy system with lots of endpoints, it can be easy for things to get lost.
Now, we’ve added an Events page to the top navigation that will display the full history of events, so that events don’t get lost. You can also get to this page from a button we’ve added to the bottom of the Dashboard.
🔗Small improvements
A variety of tiny improvements round out ServicePulse 1.25:
- In the case where ServicePulse has successfully connected to ServiceControl but there happens to be no monitoring data available, the difference between that and “no connection” is now more obvious. This is most helpful when originally setting up monitoring, before the monitoring plugin has been added to the endpoints.
- We moved the Heartbeats configuration to the Heartbeats page, to keep all heartbeat-related information together.
- We added a version check for ServiceControl Monitoring which will let you know when that service requires a software update. (This feature requires ServiceControl version 4.9.0 or later.)
🔗Summary
ServicePulse is an indispensible tool to help you keep tabs on your NServiceBus system, giving you peace of mind that everything is operating as it should and helping you to fix things when problems arise.
With our new licensing model, all customers can use ServicePulse—once you migrate it makes no difference what tier you’re on. So if you haven’t tried using ServicePulse in your system before, now’s the time. Check out our monitoring demo for an easy way to see ServicePulse in action without having to install anything.
If you’re already running ServicePulse in your system, get the latest patch version from our downloads page.
We hope the improvements in ServicePulse 1.25 will make ServicePulse more enjoyable to use, so you can get your work done faster.
 Share on Twitter
About the author